

Frequently asked questions
Have a question about interpreting reports in Google Analytics? Check our our Frequently Asked Questions for Google Analytics documentation.
Standard reports
GA provides dozens of standard reports to analyze a variety of user behavior and information. If you need a count of pageviews or events, you can use a standard report.
This documentation will cover a few common and important reports, but information about all GA reports can be found on Google’s help site. You can also find reports by using the search bar at the top of the screen within GA:
Common standard reports
Behavior > Site Content > All Pages is the most common way to see pageviews, unique pageviews, average time on page, and a few other metrics for specific page URLs or titles. Most VFS teams are interested in a specific page or set of pages and use the search filter:
If you need to do a more advanced search, such as searching URLs that start with or match a regular expression, use the advanced link next to the search field.
Behavior > Events > Top Events is the most common way to see total events, total unique events, and other metrics for specific events like downloads, form submissions, or searches. The default report displays the Event Category, though most VFS teams are looking for specific events. This can be done by clicking the Event Action or Event Label links above the data table:
The event name is almost always stored in the Event Label. For example, if your event in the code is int-accordion-expand, you would search for this string in Event Label to see the total events that occurred.
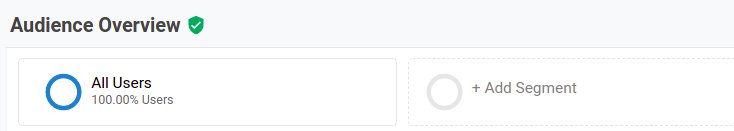
Audience > Overview is a common way to see information about users and the sessions they create. This is a bit different than the pageview and event reports. You can filter a specific date range but any additional filtering will need to be done with a segment.
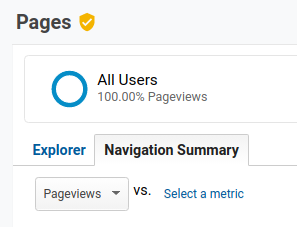
How did users arrive at the site or a page? At the session level, check out Acquisition > All Traffic > Source / Medium to see what external campaigns, social media sites, and search engines brought users to the site. Acquisition > All Traffic > Referrals will show you the external URLs that linked to the first page in the session. At the page level, add Previous Page Path as a secondary dimension or use the Navigation Summary to see the user’s previous page:
Custom reports
GA lets you build custom reports with three types of reports:
-
Explorer - All Pages and Top Pages are examples of this type of report.
-
Flat Table - Flat tables are similar to a spreadsheet. Simple, flat tables with no totals or interactions.
-
Funnel - Better than the standard goal funnel in that you can mix pages and events, but limited to 5 steps. You probably want the funnel visualization in Explore.
Custom reports are extremely valuable because they allow for configuring reports to the dimensions and metrics necessary to answer more specific analytics questions. The Analytics & Insights team can assist in developing a custom report to answer your questions (via /support in #vfs-platform-support).
Why build a custom report?
There are several situations where it would be preferable (or necessary) to build a custom report:
-
You want to create a data table with more than the two dimensions allowed in a standard explorer report
-
You want to filter by a dimension but not display it in your data table
How can I share custom reports?
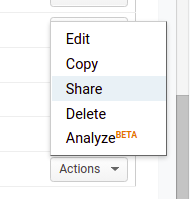
Custom reports are exclusive to the VFS team member who created them. However, you can share the template of your custom report to other VFS team members. This can be done through the three-dot menu on the Customization > Custom Reports page by selecting Share template link:
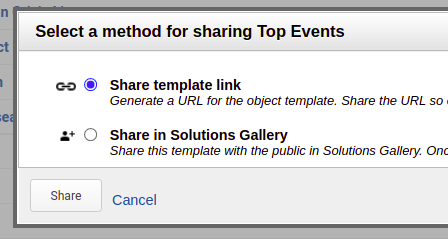
You will need to select a view to import the Custom Report. This should match the view in the original Custom Report.
Explore
This is Google’s modernized and forward-thinking take on custom reports. There are three visualizations:
-
Free Form - Create tables or charts by selecting dimensions, metrics, and segments
-
Funnel exploration - See the completion and abandonment rate of users in a series of steps (best option for most funnel visualizations in GA)
-
Segment overlap - Examine the overlap of users and sessions between 2 or more segments
Funnels
Funnels allow you to visualize and analyze the journey user take through forms and applications. There are 3 different ways to visualize funnels in GA. You probably want the funnel visualization in Explore, but we have a detailed breakdown of all types of funnels.
Segments
A segment is a subset of your Analytics data. For example, of your entire set of users, one segment might be users from a particular country or city. Another segment might be users who purchase a particular line of products or who visit a specific part of your site.
- About Segments (support.google.com)
Segments are useful for determining counts of users and sessions that meet certain conditions. Commonly this is a condition (such as users who visit a certain page or submit a certain form) or sequence (users or sessions who visit a page then later download a file). You can also create segments around geographic dimensions or time on site. Segments can filter on users or sessions.
Your custom segments can be applied to most standard reports at the top of the page:
Note that it is necessary to build a segment to get an accurate count of sessions. While adding users as a metric to custom reports will work, sessions are counted differently in GA and require a custom segment.
Training resources
All of the above Google Analytics training as well as some additional training can be found in the Intro to Google Analytics training deck.
Help and feedback
-
Get help from the Platform Support Team in Slack.
-
Submit a feature idea to the Platform.