Skip table of contents

Frequently Asked Questions

This page covers the most frequently asked questions the Platform Analytics & Insights team receives about navigating Google Analytics and Domo, understanding what data is being tracked, differences between data sources, and more.

Which property and view should I use?

Our Google Analytics account is organized into Properties and Views.

Our primary properties are:
VA.gov - Production
Within this property, the All VA.gov Website Data [Production] view includes all VA.gov websites and subdomains such as eBenefits and ChooseVA .
The WBC - VA.gov Modernized Content view only captures data from modernized sites.

VA.gov - Non-Production Environments
This includes all staging/non-production data.

The [GA4] properties capture pageview data but do not yet contain event data.

How can I tell if an interaction is being tracked (i.e. button clicks, pageviews, PDF downloads, etc.)?

The easiest way to tell if a particular interaction is being tracked is to test it directly. You can test on dev, staging, and production environments by following these steps:

  1. Download the Adswerve - dataLayer Inspector+ plugin for Chrome

  2. Go to the VA.gov webpage you'd like to inspect

  3. Click F12 to open the developer tool panel

  4. Select the "Console" tab from the developer tool panel

  5. Click the settings gear from within the Console tab to expand a list of 8 check boxes, and check the "Preserve log" option

  6. Trigger the button click or other interaction you wish to track. If the interaction is being tracked, you will see a hit in the console

    1. For example, if you click a navigation option from one of the benefit hub lists on the home page, you will see a "GA event" fire in the developer tool panel (it will be highlighted in yellow). You can see that this GA event is called “Navigation - Zone One” (screenshot below).

A GA event called Navigation - Zone One

This shows a GA event called “Navigation - Zone One”

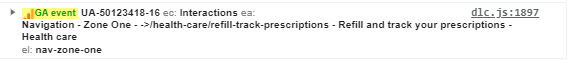
For a complete list of everything that is currently tracked and what the GA event names mean, please see our GA Events Data Dictionary.

Which design / UI components have analytics tracking built in?

The number components with analytics tracking built-in is constantly increasing. For the most up-to-date answer on a particular component, visit the storybook page and look for an enableAnalytics or disableAnalytics parameter. Note that form components - such as text boxes or radio button lists - are opt-in (enableAnalytics) due to PII / PHI concerns.

Why do the user or session metrics in Domo not match GA?

Google Analytics often uses approximations or sampling for user and session metrics on large datasets. The BigQuery datasets we use in Domo do not have these issues. Because of this, user counts in Domo will often be 0.2-0.7% different from Domo.

Sessions will usually off by a small count. If you are seeing a higher discrepancy, make sure your GA report is using a segment to count sessions.

Hit scoped interactions, like pageviews and events, should be extremely close - if not identical - between GA and Domo.

Why don't the metrics in GA not match Cloudwatch?

Google Analytics ideally captures about 80% of website traffic and events, so exact numbers may not align with back-end logging. This is due to adblockers or opt-outs that prevent data from being collected in Google.

How do I track form completions and other interactions?

As is documented on VA.gov, form completions and other interactions are tracked as individual events. For Google Analytics UA, these events are prefixed with the product. Form completions will end with --submission-successful.

What is the (other) row in my report?

From Google's documentation:

Dimensions with a large number of possible values are known as high-cardinality dimensions. Reports containing high-cardinality dimensions may be affected by Analytics system limits, resulting in the creation of a rolled-up (other) entry in the report to contain the data that exceeds these limits.

In other words, when you create a report with a high-cardinality dimension - like URL - for a large date range, it will exceed the 1 million row count in Google Analytics. GA responds by “rolling up” many dimension values in a single row labeled (other). You can avoid this issue by:

  • Switching to a lower cardinality dimension

  • Reducing your time frame

  • Exporting an unsampled report (instructions on how to do so here)

  • Using an unsampled data source like BigQuery

This has no affect on data collection, only the way reports are displayed within Google Analytics.

What are Unique Events and Unique Pageviews vs Total Events and Total Pageviews?

Unique Events and Unique Pageviews are only counted once per session. Total Events or Total Pageviews are the absolute total of all events or pageviews, even if they occur more than once per session.

These metrics are often a better technique for counting sessions since - confusingly:

An event gets credit for session with event only if that event was the first event of a session.

Is my data being sampled?

Google Analytics will not reflect every session if the report is based on session samples.

From Google's documentation:

When sampling is in effect, you see a message at the top of the report that says This report is based on N% of sessions.

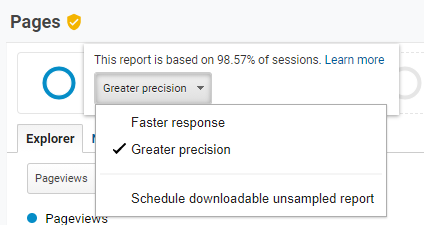
To the right of that message, you can select one of two options to change the sampling size:

Greater precision: Uses the maximum sample size possible to give you results that are the most precise representation of your full data set

Faster response: Uses a smaller sampling size to give you faster results

Dropdown used for selecting Greater Precision or Faster Response

Use this dropdown to choose greater precision or faster response.

You can also limit the timeframe of your report to avoid sampling, though scheduling an unsampled report download is a guaranteed way to obtain unsampled data for single reports.

Can I receive custom alerts from GA?

Alerts can be emailed based on any parameters set in your Google Analytics view settings. For more information on how to create alerts, please visit the Google documentation.

How do I create a segment in GA?

From Google’s documentation:

  1. Login to Google Analytics and open the View whose data you want to analyze.

  2. Open Reports. You can start with any report.

  3. Click + Add Segment...

    Audience Overview report with Add Segment highlighted

    Audience Overview report, + Add Segment highlighted.

    ...to open the segments list.

    The Segments List

    Segments list.

  4. Click + NEW SEGMENT...

    The Segments List with NEW SEGMENT highlighted

    Segments list, + NEW SEGMENT highlighted.

    ...to open the segment builder.

    The Segment Builder

    Segment builder.

  5. Enter a name for the segment.

  6. Use the options in the different categories to configure the filters you want for your segment.

    As you add filters, the Summary pane updates to give an estimate of how many users and sessions will be included in the segment. This estimate is based on sampled data, and is not intended to exactly match the number of users or sessions that will be included when you finally apply the segment to your reports.

    The Summary Update that appears as you add filters

    Summary update as you add filters.

  7. When you have finished configuring filters, you can preview and test the segment.

    Click Test to see the the percentage of users and sessions that match your segment filters.

    Click Preview to see how the segment affects the current report. If you don’t see the information you want in the report, you can continue to edit the segment, and then preview again. (When you click Preview, the Test function is automatically invoked.)

  8. When you’re satisfied that the segment includes exactly the data you want, click Save to close the segment builder and apply the segment to your reports.

How is GA impacted if my product is undergoing URL and/or funnel changes?

If your product flow undergoes changes to the URL structure, Google Analytics will not be impacted and all new URLs will be tracked. If interactions are changing and do not utilize the built-in components, please submit an implementation ticket to ensure all interactions are tracked.

Domo dashboards with form funnels will be impacted and must be updated by submitting a dashboard update ticket with your new URLs.

When should I create a custom report vs. using a standard report?

Custom reports allow you more control in combining additional dimensions and metrics. The built-in Google reports are limited as only one additional dimension can be added to a report. Custom funnel reports will also allow visualization of each step for analysis. For further details on custom report options, please see our documentation.

Who can I reach out to with my other analytics questions?

If you have any additional questions or concerns we are happy to help! Please reach out to Platform Analytics & Insights using the /support command on #vfs-platform-support. Or attend one of our office hours:


JavaScript errors detected

Please note, these errors can depend on your browser setup.

If this problem persists, please contact our support.