Creating effective monitors
This page helps you understand how to create effective monitors by covering everything from accessing Datadog to using the Platform Monitors and Alerts Dashboard. If you have a specific issue, you can use the table of contents on the right side of this screen to jump to the section that addresses your issue.
Accessing Datadog
To access Datadog, go to https://vagov.ddog-gov.com/
If you are a Platform Operator that needs a Datadog user account, see Get Access to Datadog
Monitoring - General Overview
Monitors should be wide. This means that a single monitor should cover a pointed metric (or metrics) across a vast number of same-type resources (e.g., monitor available disk space across all EC2 instances).
Monitors have two thresholds:
A Warning - A warning is a heads-up that you may soon have to take an action.
An Alert - An alert must be done immediately or as soon as possible.
Keep these two important distractions in mind while creating monitors.
Create alerts that require human action; otherwise, you can drown out actionable alerts.
Monitoring - Methods & Approaches
The two methods that provide the best coverage of the systems (hardware) and the services (software) on the platform are USE and RED. Below us a quick rundown of each method.
USE
We use USE for systems in three primary ways:
Utilization - How much work is being done
Saturation - How much work cannot be done
Errors - System errors, I/O errors
RED
We use RED for services
Rate of requests
Errors - Service errors like, say, HTTP error codes
Duration - This is a measure of latency
Create a New Monitor
After logging in to Datadog, on the left-hand side, select “Monitors” followed by “New Monitor”
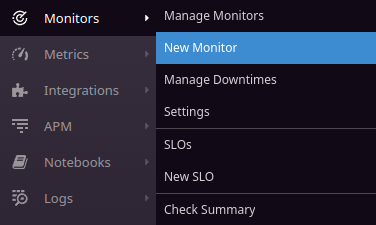
Select “New Monitors” to continue
Datadog Monitor Types
Datadog offers several monitor types. Let’s take a look at the two main monitor types, look at what they do, and why they are important.
1. Metric, Threshold Alert
The Threshold Alert is going to be your choice 99% of the time
The Threshold Alert is a good place to start, but it is worthwhile to experiment with the others. There are three factors to consider when using the Threshold Alert:
Be sure that the resulting metric is actually what you want to alert on. Often, it may require more than one metric plus the addition of an equation to get the final metric.
Be considerate about the evaluation period. The evaluation period can be the difference between a very noisy alert (not very useful) and a very meaningful alert.
This is how you want your alerts to be grouped. It will default to what your metric is grouped by
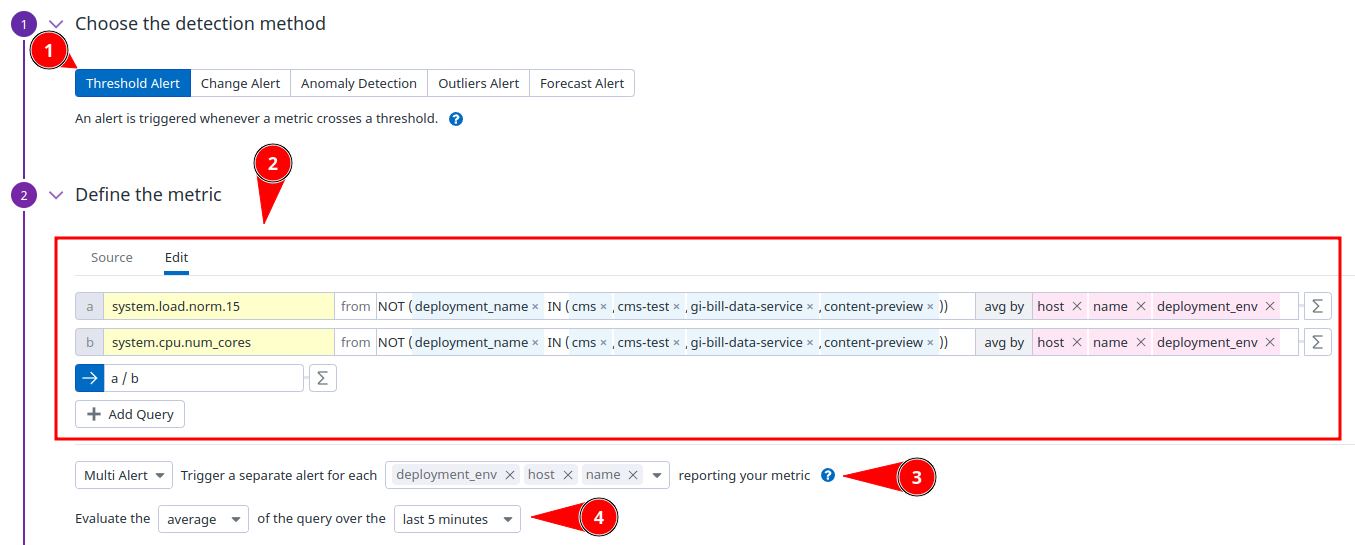
How to properly group alerts
2. Composite
A composite monitor allows you to create conditions where alerts only take place when a chain of monitors is firing. This is a good choice when you want to alert on a combination of monitors.
For Example: It does not make sense to alert on high CPU if the system load is < 1, as this just means we are utilizing the system well. We only want to alert when there is both high CPU as well as high system load as this indicates a system that will begin showing performance problems
Be cautious when using other monitor types - Other monitor types can get very noisy due to our systems being very dynamic (e.g., the anomaly detection is probably a bad choice for most monitors as our system can go from 0 - 100 really quickly, and that’s normal)
Datadog Monitor Settings
Missing Data Options
AWS resources such as EC2s are ephemeral and are [re]deployed regularly. As such, if you do not auto-resolve for missing data, a monitor can alert indefinitely – if an alert triggers on a resource, but then that resource is torn down, the alert will never resolve because the resource will never fall below the threshold for the alert.
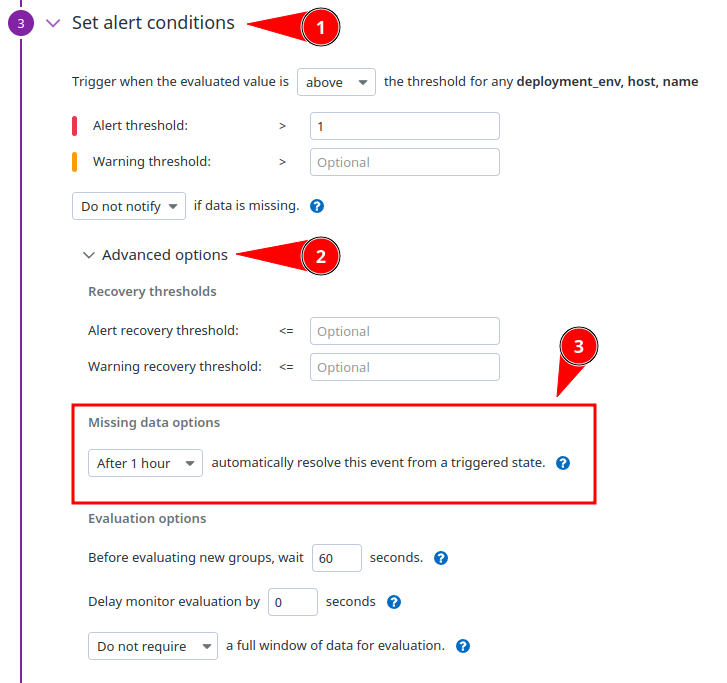
How to access and update “Missing data options”
Datadog Notification Settings (Alerts)
Alerts should be actionable items. If you find that an alert is triggered, but there is no action to take, it may be a good candidate for removal or used in combination with another monitor (a “Composite Monitor”).
Things to consider when setting up alerts
Be thoughtful about whom you send notifications to
Be thoughtful about when you send notifications
A notification to PagerDuty will wake someone – these notifications must be sent only during an outage or when the user is severely impacted
Send to
@slack-platform-datadog-alerts-testwhile testing your alerts to validate that they are not spamming or creating unnecessary noise
Setting up an alerting chain
To set up an alerting chain, follow the following steps:
1. Decide on the Alert Chain
To help determine where you should send alerts, consider walking through the following flow:
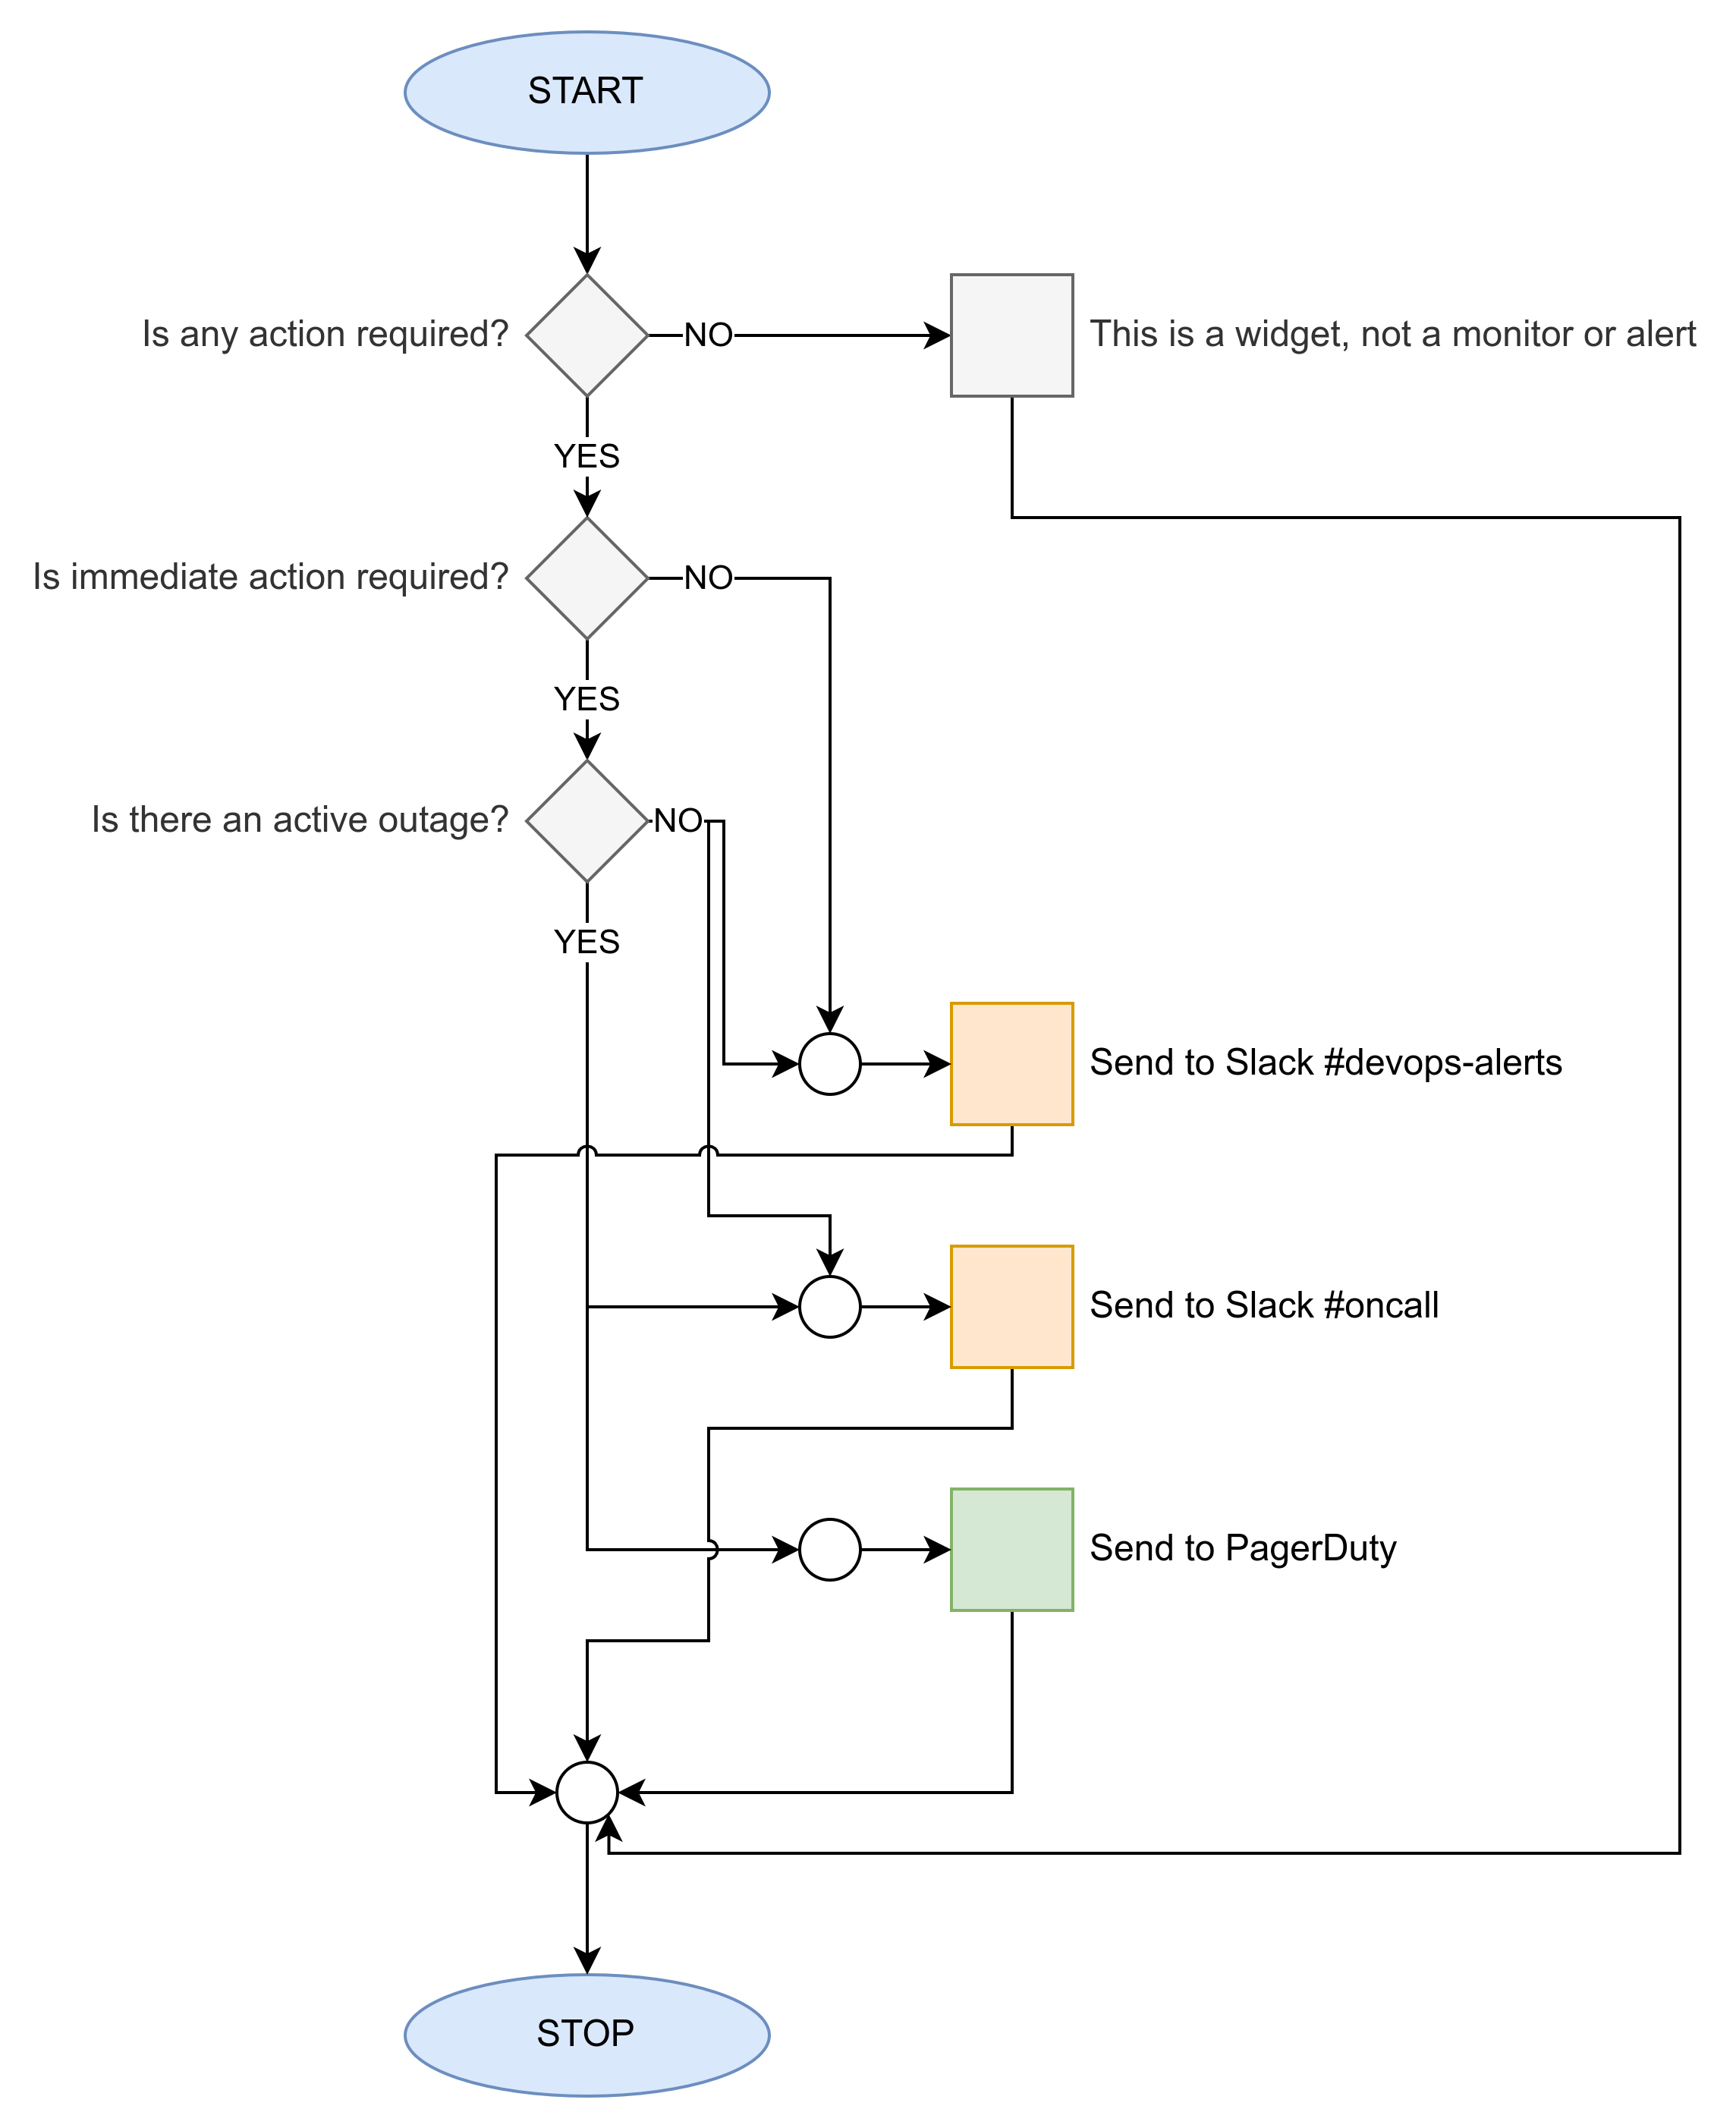
Flow chart for deciding to send an alert
2. Set up a Development Alert Chain (dev alerts)
While testing/developing your monitor, use the following alerting chain. This will send all alerts to a test channel that you can monitor for noise and adjust as you see fit. Once you are confident that the alert will not be noisy and is drawing attention to an actionable item, you can update the alerting chain to use the “Final Alert Chain” in the next section.
@slack-platform-datadog-alerts-test 3. Set up the Final Alert Chain (staging, prod alerts)
For configuring alerts, use the following code snipped. Modify deployment_env.name to use the appropriate field, e.g., dbinstanceidentifier.name when alerting on ElastiCache or RDS. Only send notifications to channels that are appropriate (i.e., sending a warning to on-call would not be appropriate). This template is a starting point and should be adjusted as you see fit.
{{#is_alert}}
  {{#is_match "deployment_env.name" "prod"}}@slack-Digital_Service__VA-oncall{{/is_match}}
  @slack-Digital_Service__VA-devops-alerts
{{/is_alert}}

{{#is_warning}}
  @slack-Digital_Service__VA-devops-alerts
{{/is_warning}}

{{#is_recovery}}
  {{#is_match "deployment_env.name" "prod"}}@slack-Digital_Service__VA-oncall{{/is_match}}
  @slack-Digital_Service__VA-devops-alerts
{{/is_recovery}}
Pager Duty
Sending a notification to PagerDuty will wake somebody up.
Do not send notifications to PagerDuty unless there is an outage or severe impact on the user. It should be a rare occasion to include PagerDuty in your notification block, and when you do, make sure to think twice thrice about it.
Add a monitor to a Dashboard
Once a monitor is created, it’s standard practice to add it to a monitoring dashboard. This helps with development (everyone can see and help with what others are working on) and review (seeing the monitors in their categories versus stand-alone).
The “Platform Monitors and Alerts” Dashboard
Look at the Platform Monitors & Alerts Dashboard to see if there’s a logical place to add a new monitor.
An existing application, component, or service with existing monitors might exist, but feel free to create a new one! The goal is to increase observability and monitoring in a meaningful, actionable, and relevant way according to evolving needs.
See Platform Dashboards in Datadog for a list of available dashboards. Or, create a new one!
Add a new widget
At the bottom of each dashboard, you’ll see a large button to add a Widget; click it.
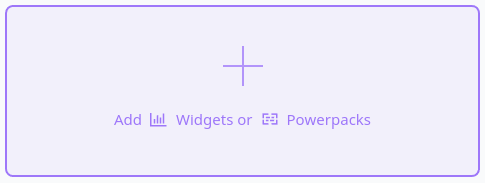
The large “Add a Widget” button
A menu will slide out and offer a variety of widget types for you to add. For monitors, scroll to the bottom of that list and select “Alert Graph”. There may be times when you will select the other Alerting widgets, but more times than not it will be the “Alert Graph” option.
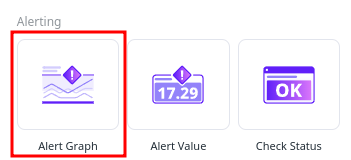
Alert Graph option
At the next window, you will choose your monitor from the drop-down. You may scroll to your monitor by name or begin typing out a portion of the monitor’s title to filter faster. Please leave the title as-is; by default, it will match the title you gave to your monitor. Once you have your monitor selected, press the “Save” button.
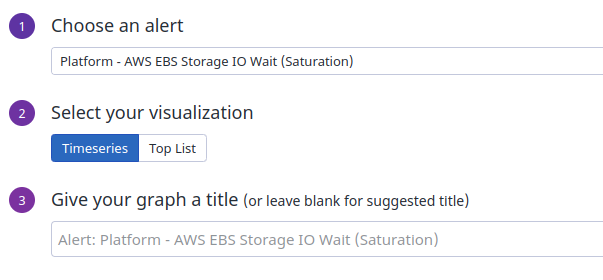
Choose your monitor from the dropdown
Questions?
If you have any issues or questions, please reach out to the following:
For questions about platform monitors, contact Platform Support on the #vfs-platform-support Slack channel.
For questions about watchtower monitors, contact the Watch Officer on the #octo-watch-officer Slack channel.
For general questions about using Datadog, reach out on the #public-datadog Slack channel.
Help and feedback
Get help from the Platform Support Team in Slack.
Submit a feature idea to the Platform.
