How-To: Event Reporting with Explore Reports
Last Updated: September 6, 2024
The goal of this training is to provide viewers with the knowledge and skills to create an Explore report in Google Analytics 4 (GA4). Explores reports will help you uncover deeper insights about your users' behavior.
Step 1: Select Dimensions and Metrics
Navigate to Google Analytics 4. Check that you are in the [GA4] VA.gov Production Property. Once the property is selected, click on the Explore button, (indicated by the green arrow, on the left-side menu).
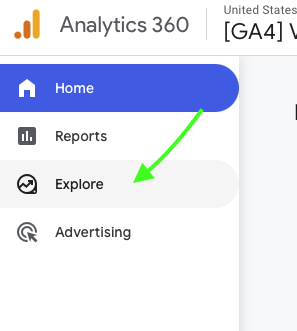
Explore report button
On this page, users are able to create customized Explore reports. To create a new Explore report, click on the Blank (Create a New Exploration). To add content to a report, metrics and dimensions need to be added to the page. To do so, click on the plus sign next to Dimensions/Metrics.
Note:
Metrics are quantitative measurements that are always numbers, such as averages, ratios, or percentages.
Dimensions are attributes of data that are usually text, and provide context to metrics.
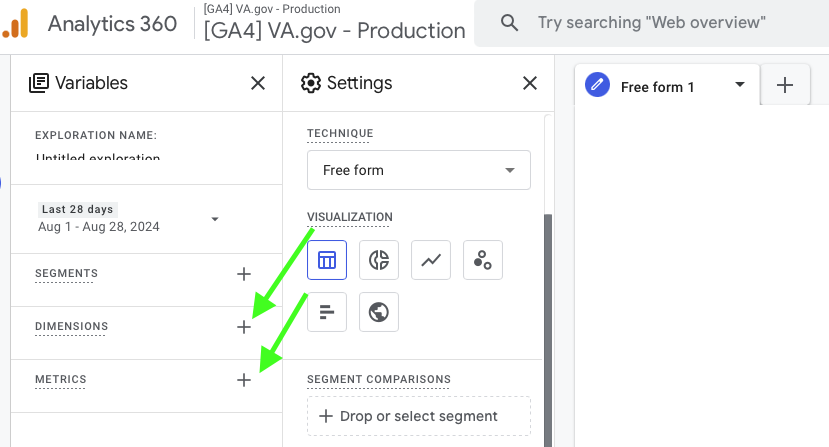
Dimension and Metric sections
Step 2: Add Dimensions and Metrics into Variables
In the Select dimensions window, search or scroll for the dimensions you want to include in the Explore report. Select the box next to the dimension you want to add, and click Import to add the selected dimensions into the reports.
Repeat this same step for Metrics.
Note: To follow along with the GA4 training, select Page Path and Screen Class, DataLayer Event Name, and Event Name for your dimensions. Select Event Count for your metrics.
How to add/select dimensions/metrics
Step 3: Add Dimensions and Metrics into the Report
Now that you have selected your dimensions and metrics, they will need to be added into the report. Select the variable you want added by clicking on the +Drop or select dimension/metric button, or simply drag and drop it.
Helpful Tip: By default, Explore reports will only show 10 visible rows of results. To show more, click on the Show Rows dropdown, and select up to 500 rows to increase the number of rows that will be visible on the report.
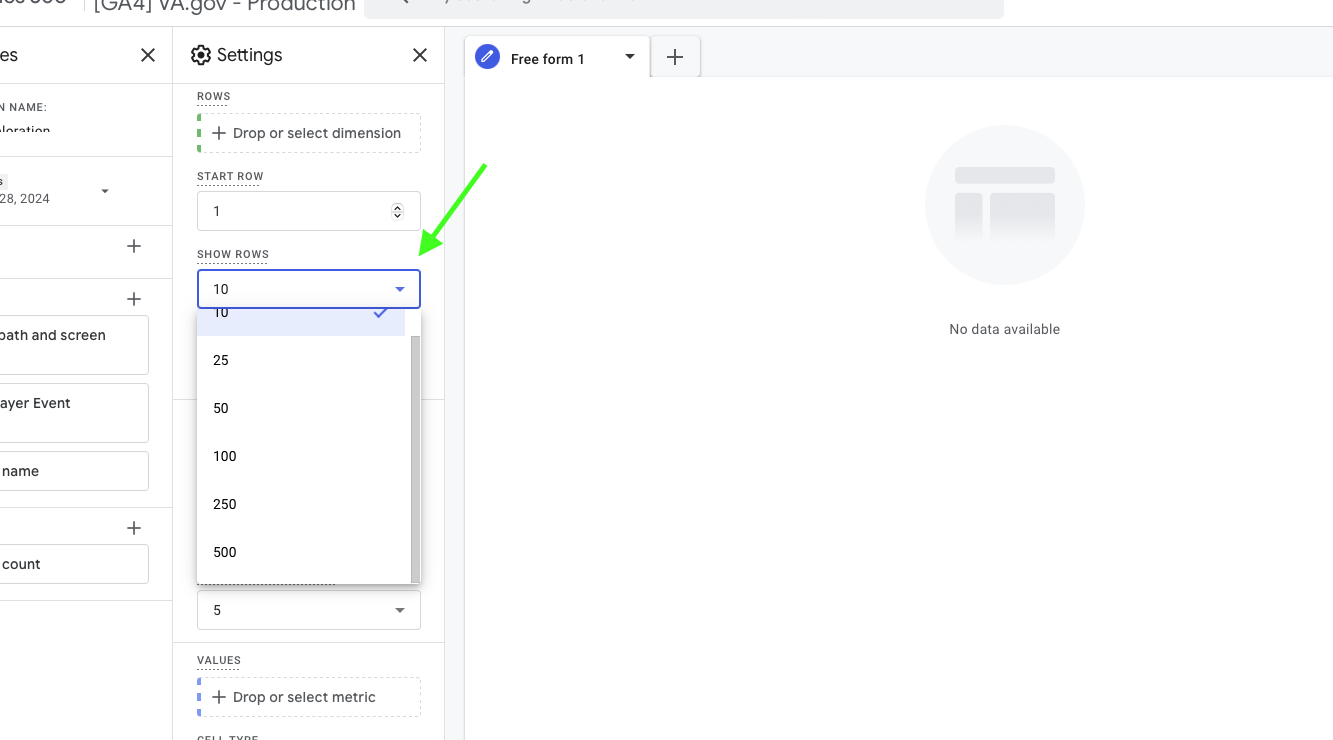
Change the amount of rows
Add all of the dimensions to the Rows section and metrics into to the Values section.
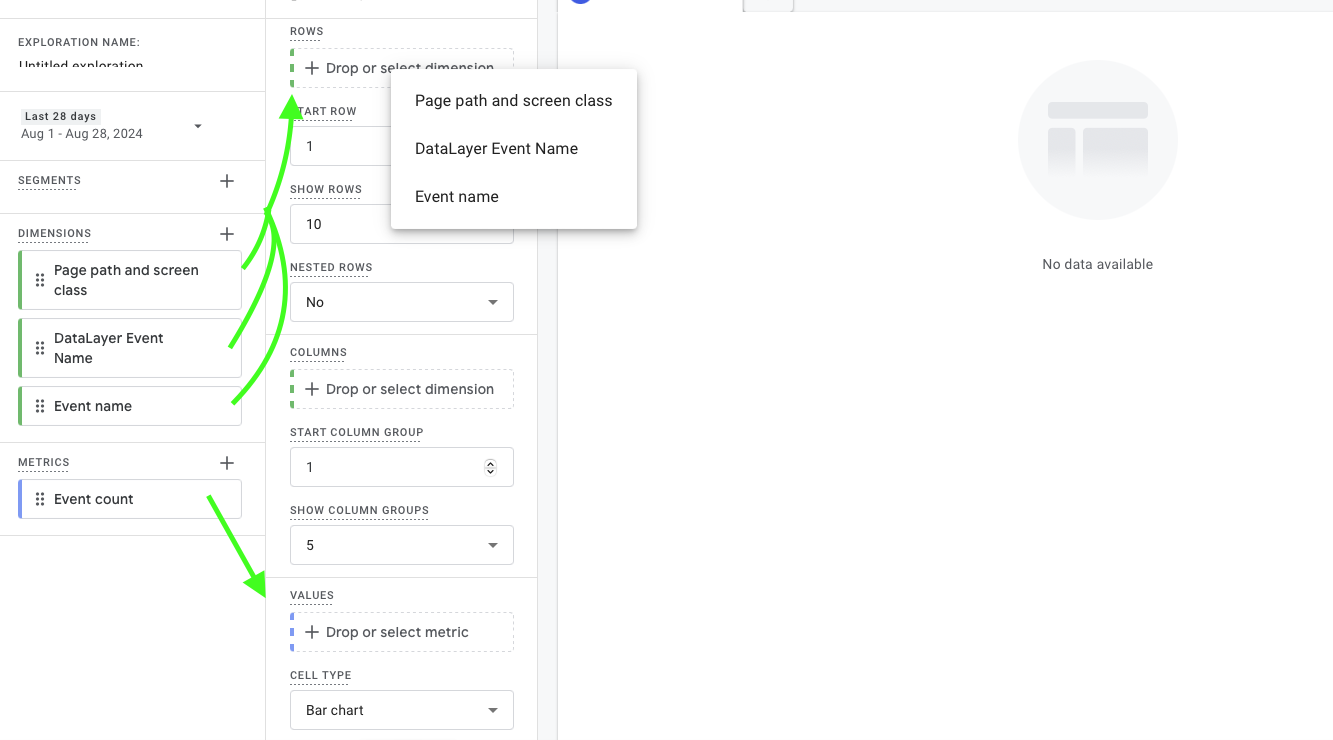
Add dimensions and metrics to rows and values
Dimensions can be added to the Rows section or the Column section. For this training exercise, we will add both Page Title and Event Name to rows.
Metrics can be added to the Values section. Add Event Count under values.
Both metrics and dimensions can be used in report filtering.
With the metrics and dimensions added, there will now be a chart that displays the Page Path and Screen Class, Event nNme, dataLayer Event Name and Event Counts.
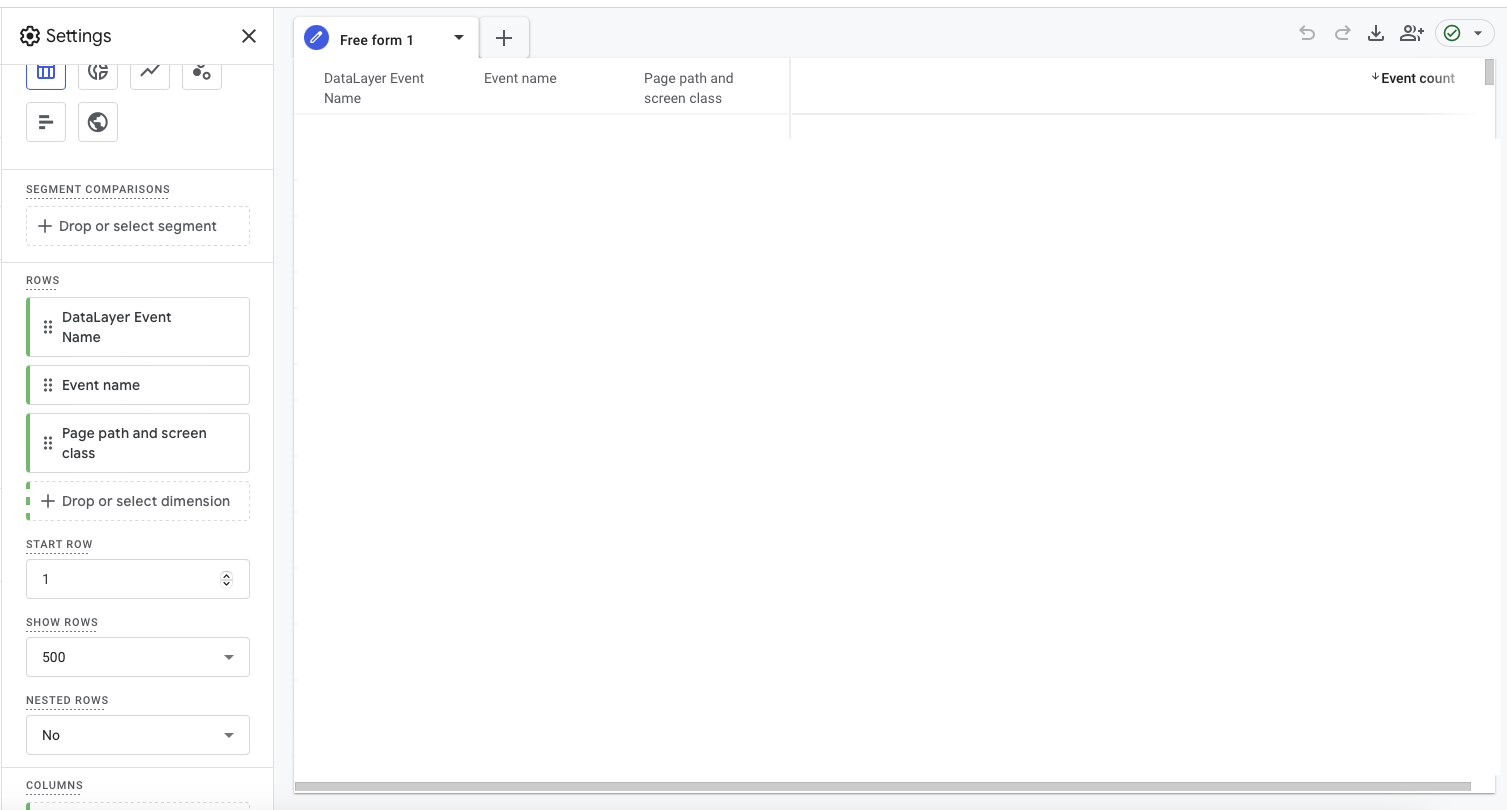
Explore report with applied dimensions/metrics
Step 4: Find Information that's Relevant to You
There will be a lot of data populating into the chart. To limit the visible data, apply filters to your report. Scroll to the bottom of the settings column where there is a Filters section (green arrow). Drag & drop or select the metric/dimension you want to filter by.
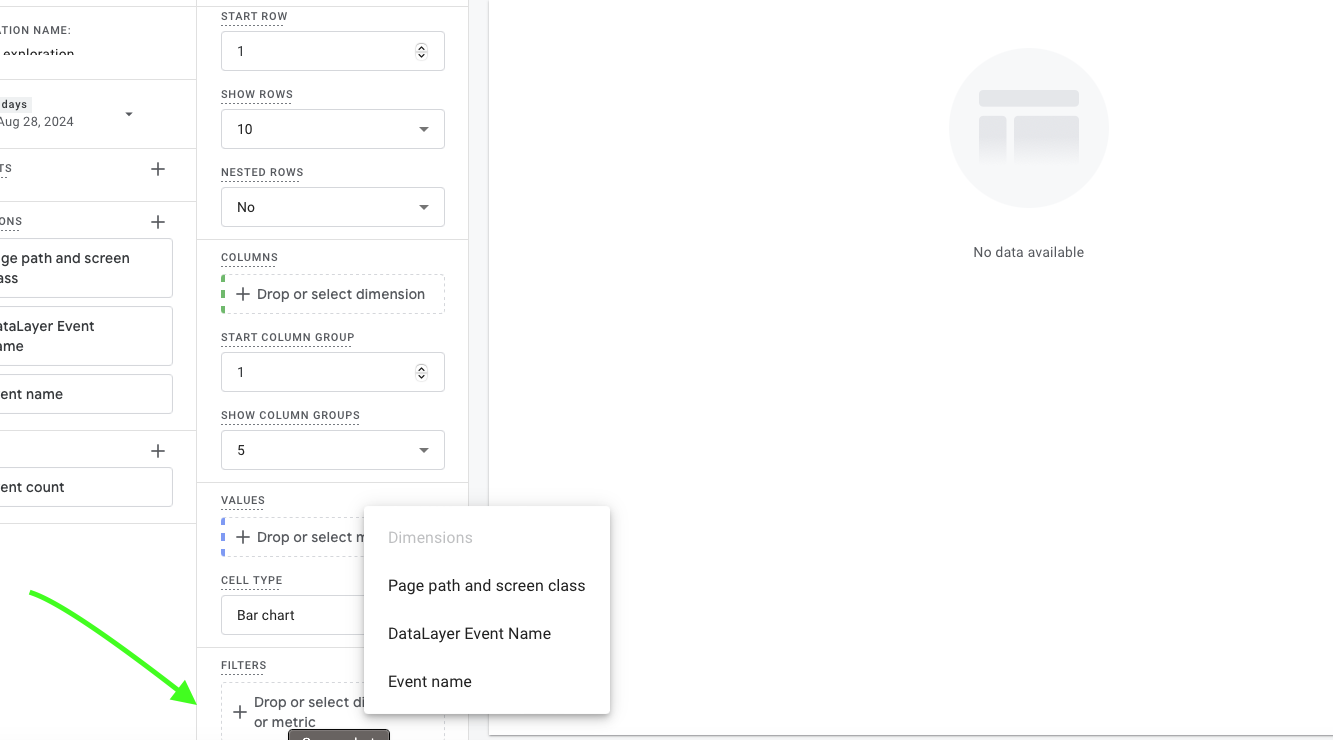
Filters option, bottom of settings column
Set the Conditions of the filter, there are various options to chose from. Select “contains” to follow along. After selecting the condition, an expression must be entered or selected. Type into the [Enter expression] section. Once all sections of the filter are completed and matches the image, click the Apply button in the bottom right.
.png?inst-v=51bfabf8-d1f6-4560-b6c0-8c38cc2512f8)
Filter settings
The report will change to only show the filtered data. If the report is not specific enough, more than one filter can be added to filter the data even further. To do so, drag or select the metric event name into the filter section.
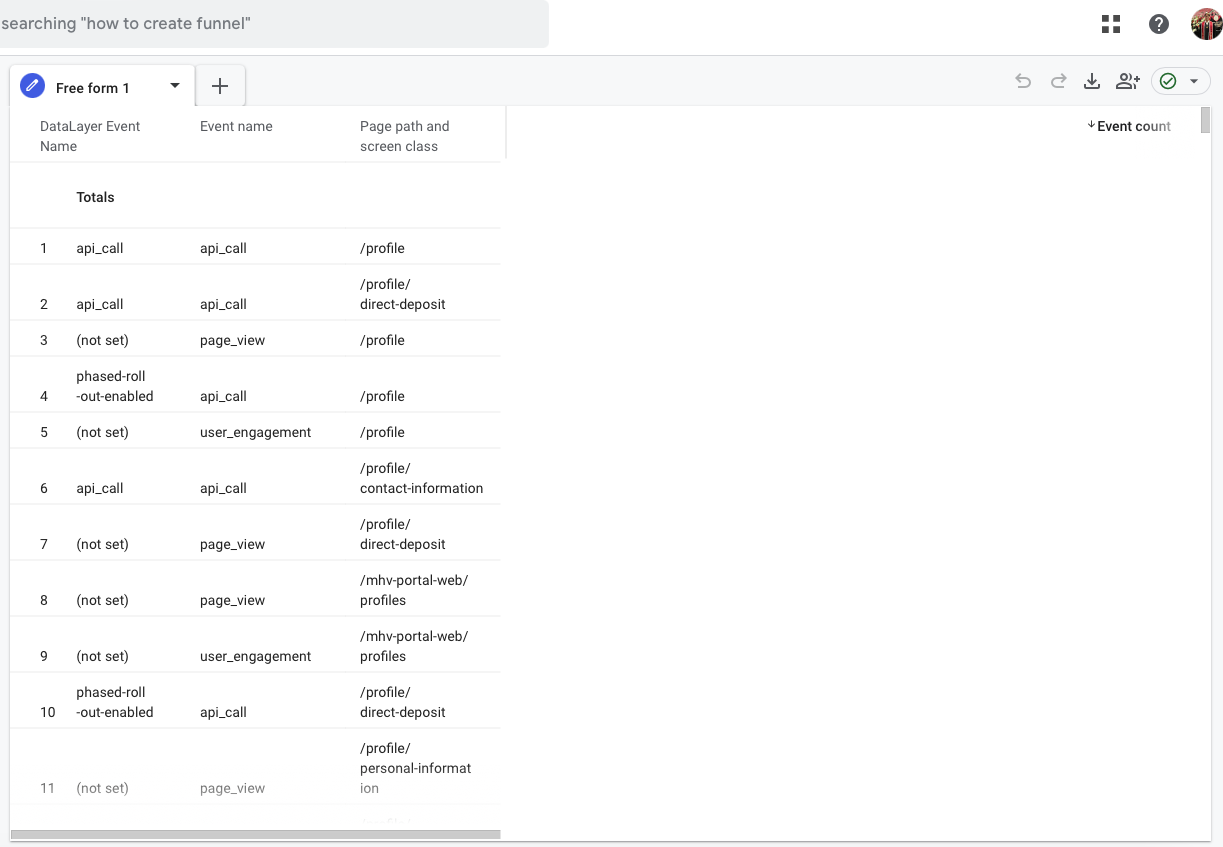
Final Explore report, with applied filters
The end result is a fully function Explore report, which compares event counts based on Page Path and Screen Class, Event Name, and DataLayer Event Name.
The Explore report has filters, which can be changed, to display data applicable to users specific teams and/or event names.
Help and feedback
Get help from the Platform Support Team in Slack.
Submit a feature idea to the Platform.
