

What is Datadog?
.jpg?cb=bc2bb4698ac977159e52f28af532df0d)
Datadog is a Software-as-a-Service (SaaS) solution for monitoring infrastructure and applications.
Platform Operators can view metrics, create monitors and dashboards, and set up alerts (or other notifications) that can be sent to Slack and PagerDuty.
Metrics are collected from all Platform software applications and infrastructure hosts. Dashboards, monitors, and notifications can be viewed through Datadog web UI
Note: Datadog boasts 600+ integrations (See here).
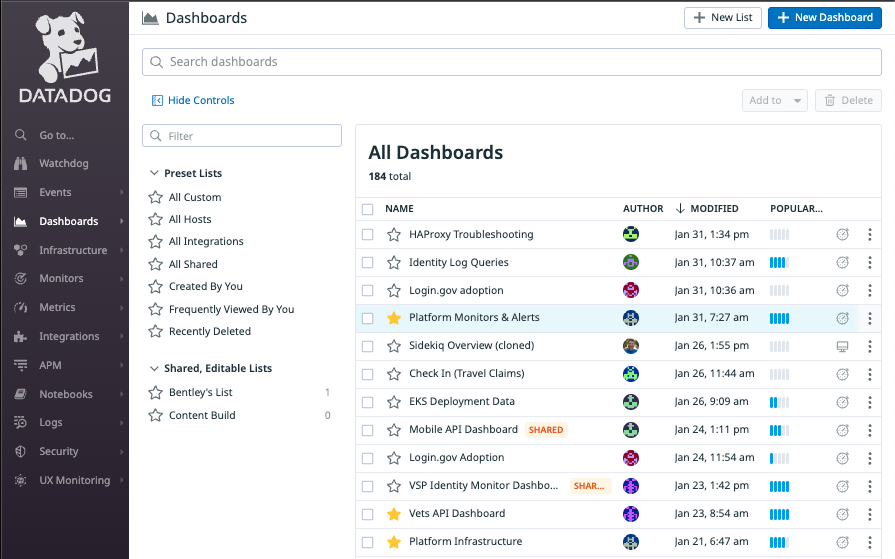
Dashboards
Dashboards can be found in the left-hand navigation.
Dashboards can monitor backend applications (i.e., Vets-API), AWS services, Kubernetes resources, connections with external services, and more.
See Platform Dashboards in Datadog for a list of dashboards covering various aspects of Platform health and performance.
Monitors & Alerts
Monitors can be found in the left sidebar of the Datadog homepage.
Monitors send notifications - also known as alerts - to various communication channels (such as Slack and PagerDuty) depending on the importance and severity of the thing being monitored.
Additional Features in Datadog
There’s a lot that Datadog can do, and this is only the tip of the iceberg!
If there’s a capability you'd like from the Platform’s Centralized Monitoring Solution, feel free to submit a feature request by visiting the following page: https://depo-platform-documentation.scrollhelp.site/support/submitting-a-feature-request
Next
Platform Dashboards in Datadog
Resources
-
Datadog Documentation
Help and feedback
-
Get help from the Platform Support Team in Slack.
-
Submit a feature idea to the Platform.