

Last Updated: July 7, 2025
When troubleshooting errors in vets-api there are several tools available.
-
Sentry for error discovery/tracking
-
Datadog for logs, error tracking, and metrics
-
ArgoCD for deployment errors
This page explains how to investigate errors in those places.
Datadog logs
Detailed logs for Vets API for all EKS environments are stored in Datadog.
Datadog access is required to view the logs.
Logs can be filtered by container, pod, urls, IP addresses, etc.
Datadog error tracking
Datadog access is required to view errors.
Datadog provides an error tracking framework. This is similar to Sentry.
Sentry
Datadog is preferred over Sentry for error tracking.
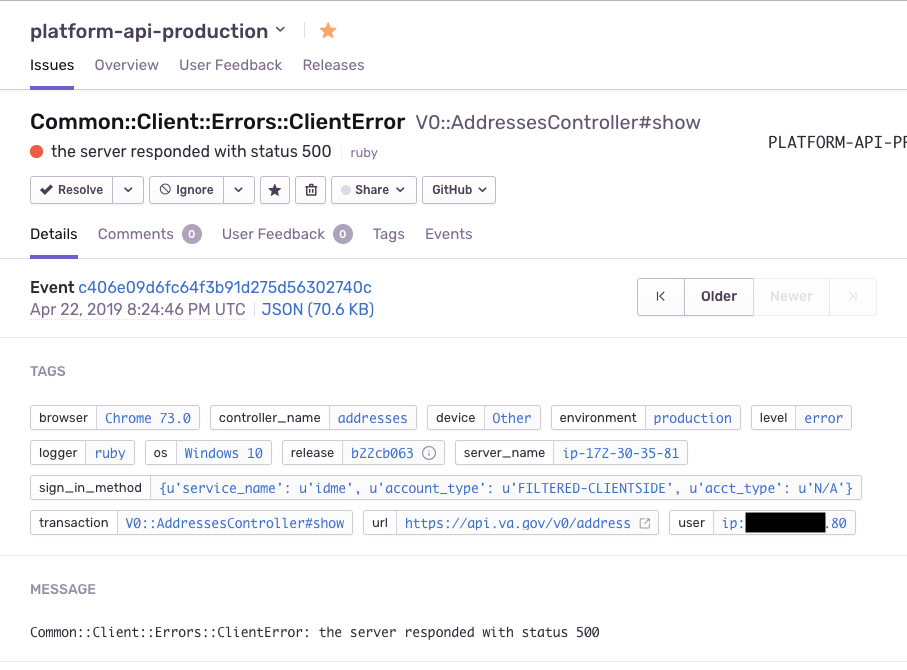
Sentry tracks API errors. This was primarily used to track errors before Datadog. There are Sentry 'projects' for each of our environments: platform-api-development, platform-api-staging, and platform-api-production. Selecting a project brings up a list of 'Unresolved Issues' sorted by 'Last Seen' date. Other sorting options are: 'Priority', 'First Seen', and 'Frequency'. Priority being one of the most useful as it's a time decay algorithm that uses the total frequency to show both consistently noisy and new issues.
Once you've found a Sentry issue you're interested in you can click it to view the details. The official Sentry docs cover issue details but there are areas of interest in how we use each section:
-
Tags: The auto-generated Rails tags, in concert with our custom tags, provide extra issue details.
controller_nameandtransactionlet you know the source of an issue.sign_in_methodmarks if the user signed in via ID.me, DSLogon, MHV, or Login.gov. Theteamtag marks an issue as belonging to an app team. -
Message: This section maps to the original exception's message. An identical message will appear in the AWS CloudWatch logs in the
messagefield.
-
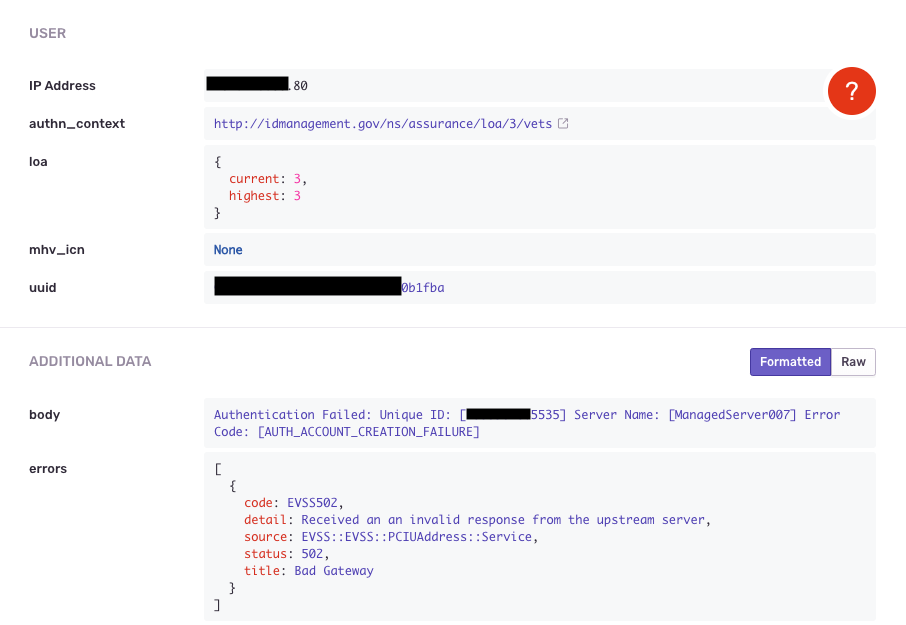
User: Provides the
authn_context(authentication context), the user's LOA level, and their UUID. -
Additional Data: Unless filtered, the request
bodyand extraerrorsdetails are here.request_uuidis a valuable field for correlation with AWS CloudWatch logs.
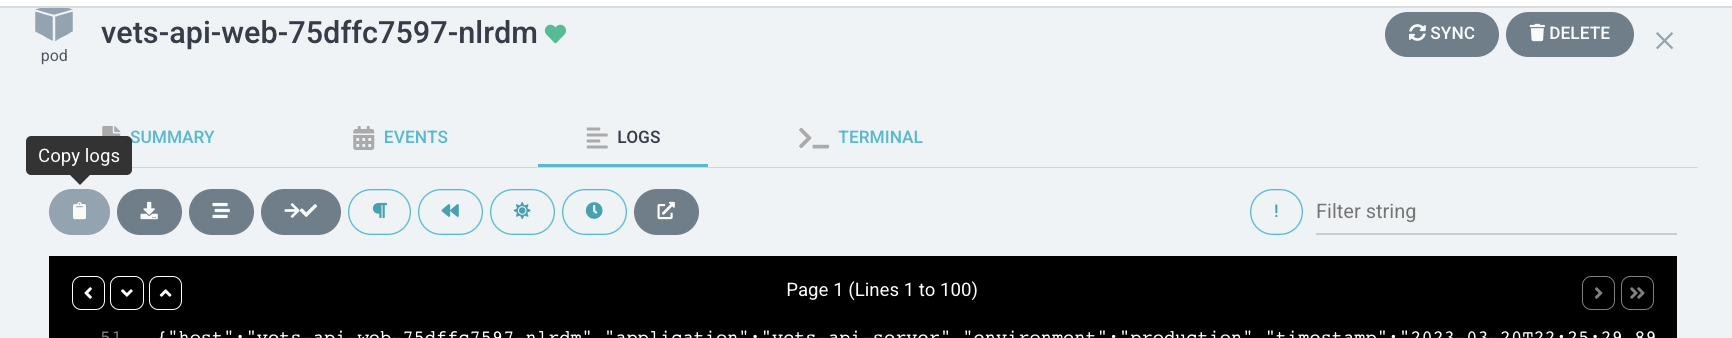
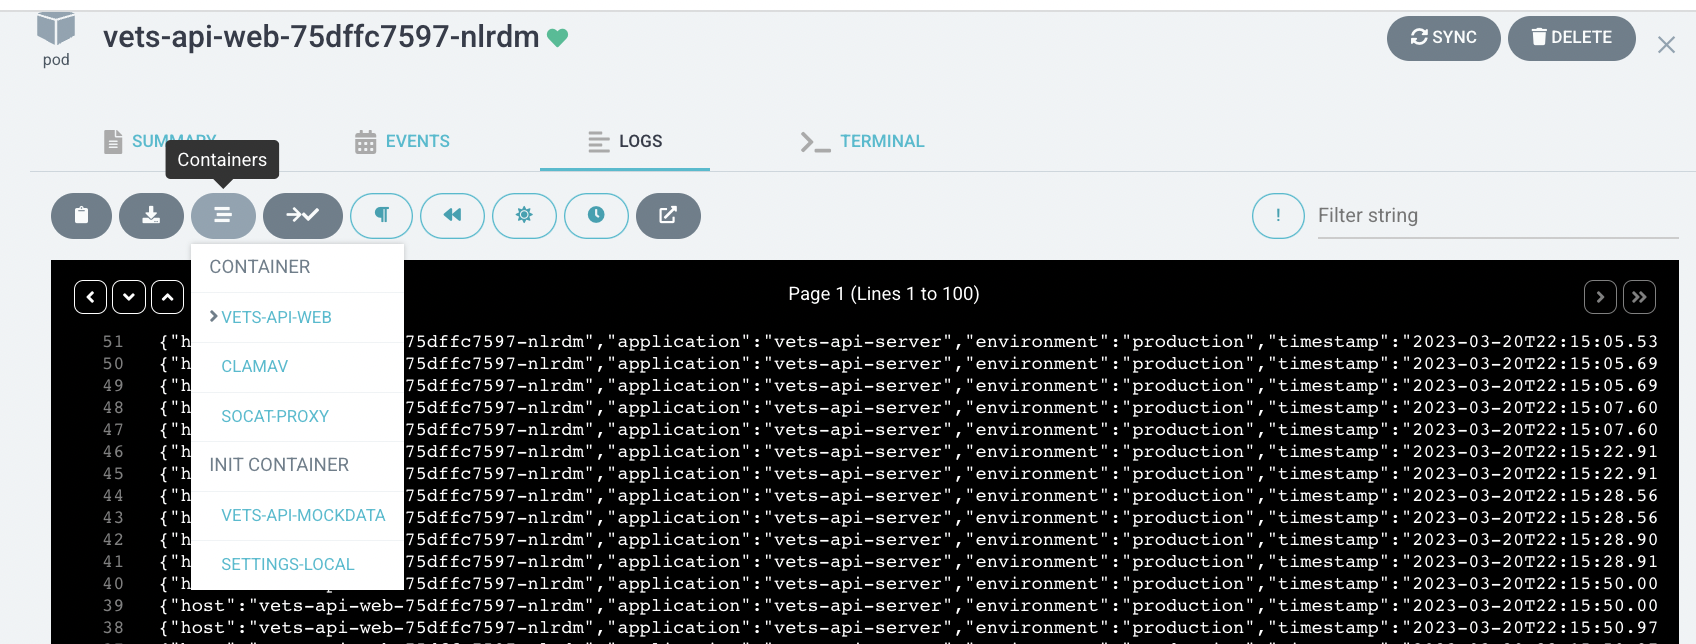
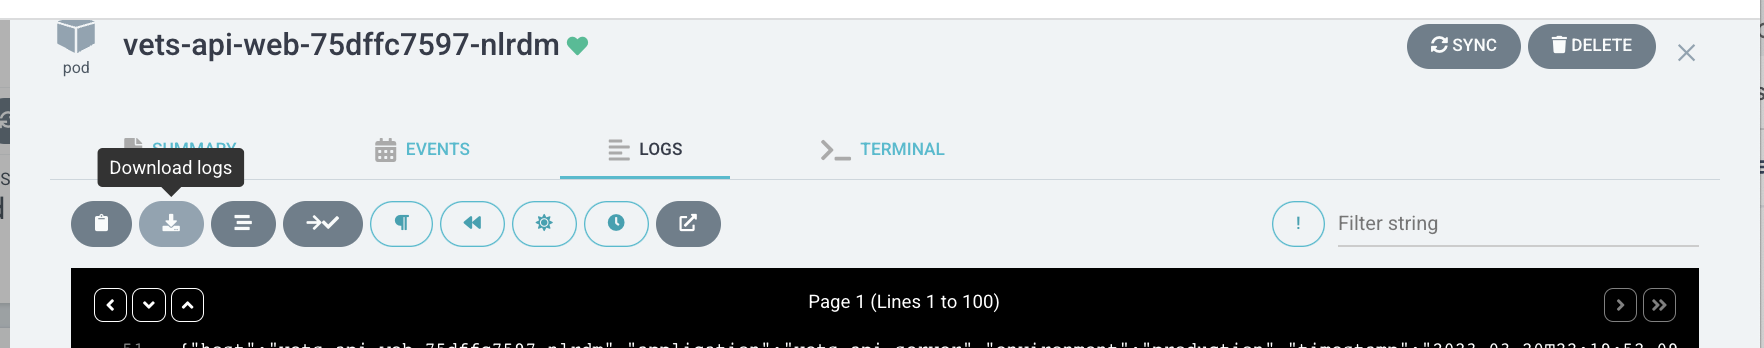
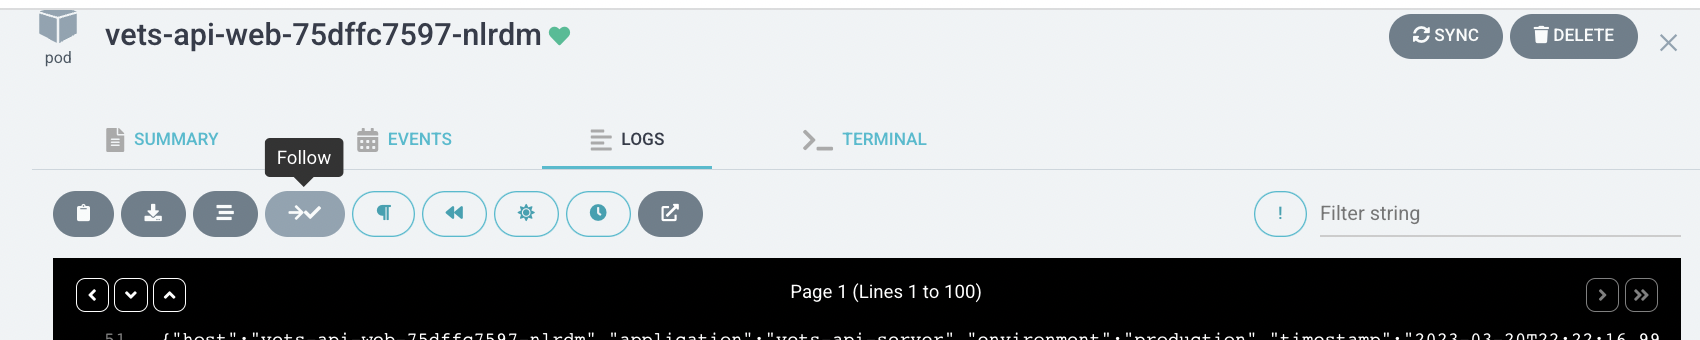
ArgoCD logs
ArgoCD container logs can be viewed in the Logs tab inside each pod. Logs can be viewed, copied, downloaded, and followed.
ArgoCD access is required to view ArogCD logs
Long term error tracking
See also the StatsD Metrics page.
Tracking totals from the api:
StatsD.increment("service.method.total")
For failures we can add tags to differentiate error types within failure totals:
StatsD.increment("service.method.fail", tags: ["error:#{error.class}"])
The above pattern is common enough in service classes that it's been abstracted out to a concern, Common::Client::Monitoring, which can be mixed in to a service.
module EVSS
  class Service < Common::Client::Base
    include Common::Client::Monitoring
Service calls can then be wrapped in a block that automatically records totals and failures:
def get_appeals(user, additional_headers = {})
  with_monitoring do
    response = perform(:get, '/api/v2/appeals', {}, request_headers(user, additional_headers))
    Appeals::Responses::Appeals.new(response.body, response.status)
  end
end
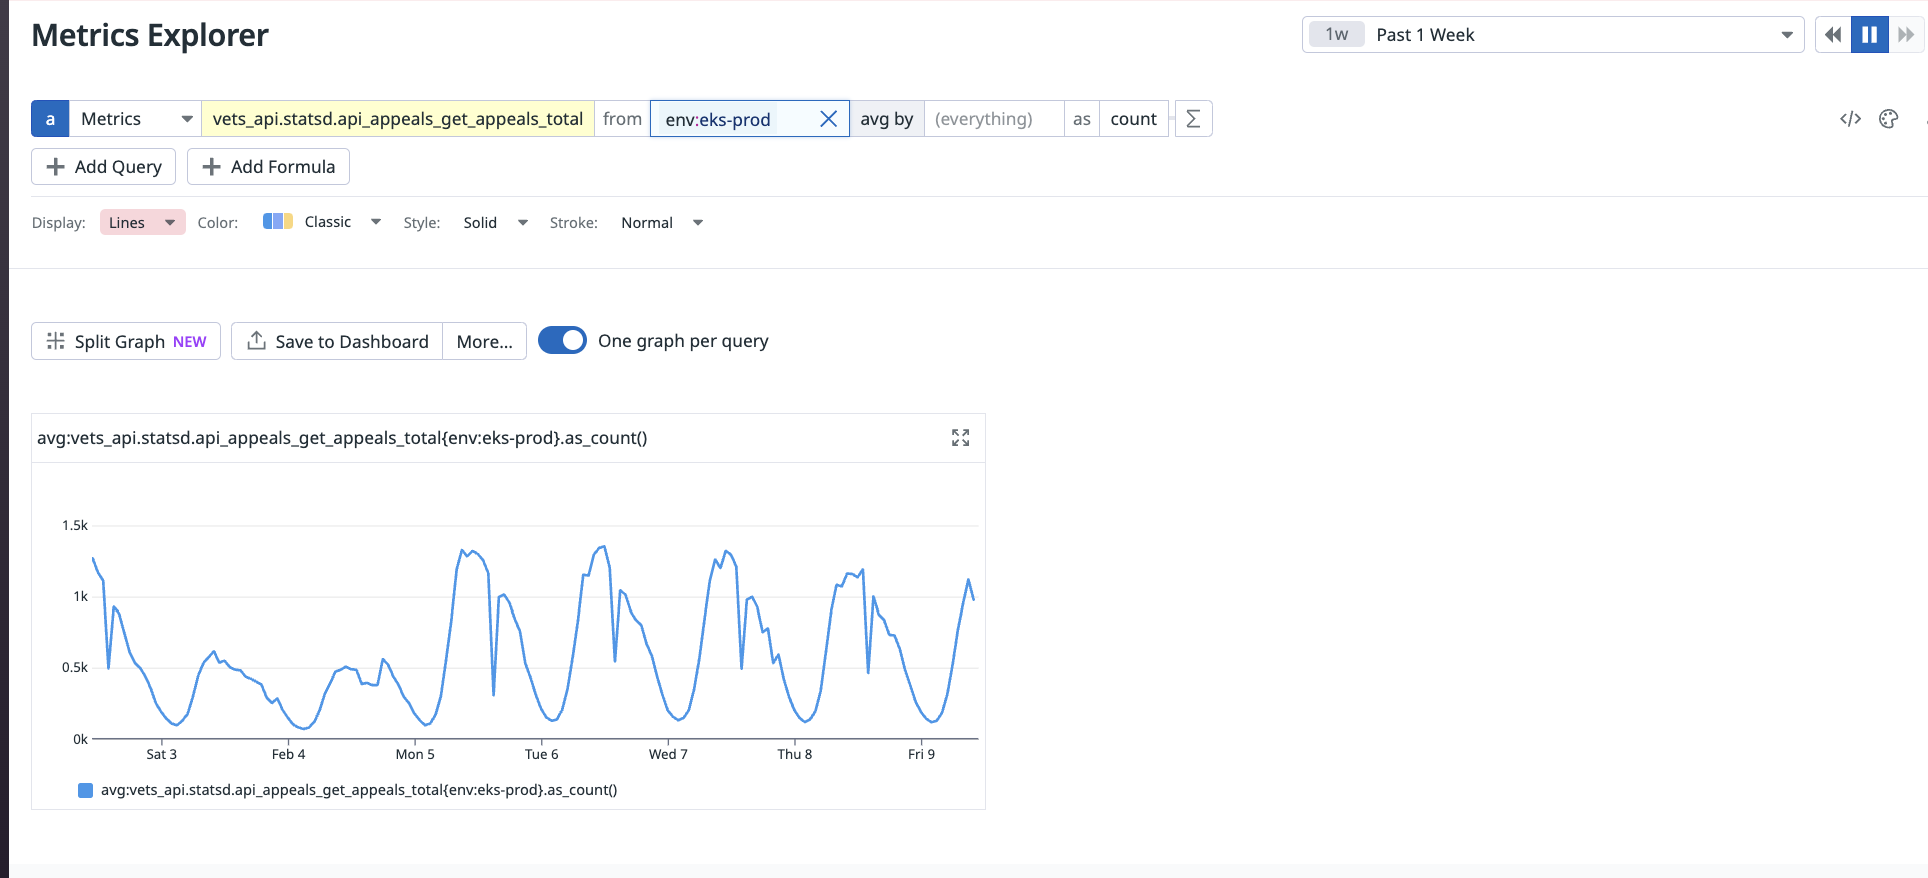
With those calls in place we can query for the average across deployed server instances in Datadog:
avg:vets_api.statsd.api_appeals_get_appeals_total{env:eks-prod}.as_count()
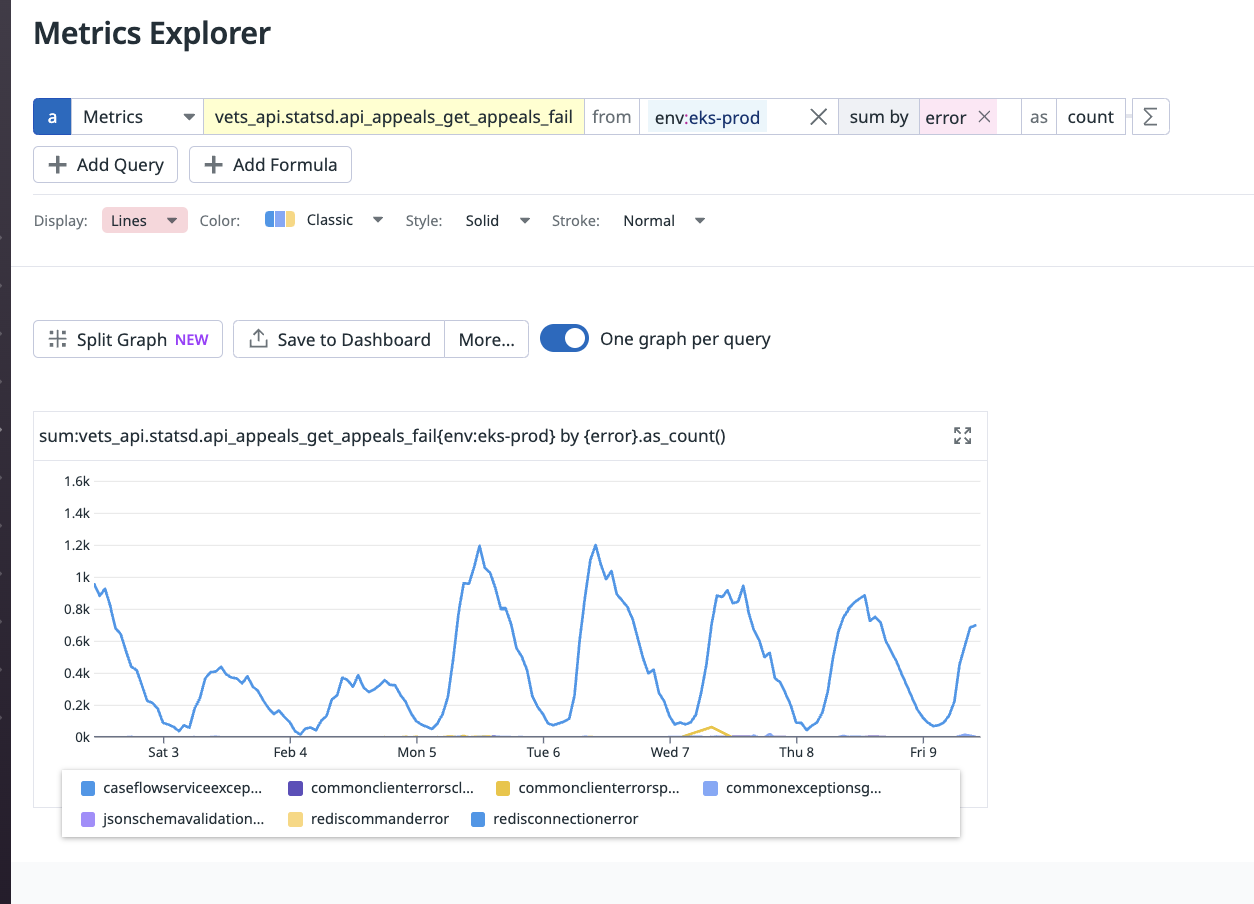
The error query can filter by error tag:
sum:vets_api.statsd.api_appeals_get_appeals_fail{env:eks-prod} by {error}.as_count()
Help and feedback
-
Get help from the Platform Support Team in Slack.
-
Submit a feature idea to the Platform.