

The QA Product Dashboard is hosted in DOMO. It displays quality assurance (QA) practice data for a product hosted on VA.gov. You can view the dashboard to see if your product meets Platform QA standards. We evaluate products for their end-to-end test presence, end-to-end test flakiness, unit test coverage, and Google Lighthouse accessibility score.
On this page, you’ll find explanations of what each QA Product Dashboard section shows, why we track it, and what conclusions you can take away from it.
Request DOMO access
To access the QA Product Dashboard, you first need access to DOMO. If you don’t already have access to DOMO, here’s how to get access:
-
Go to the GitHub VA Issues page and scroll down to “Analytics Access - Google Analytics/DOMO - Request Template.” Select “Get started.”

This is where you need to scroll to on the GitHub VA Issues page. -
Fill out the GitHub issue using the template instructions and select “Submit new issue.”
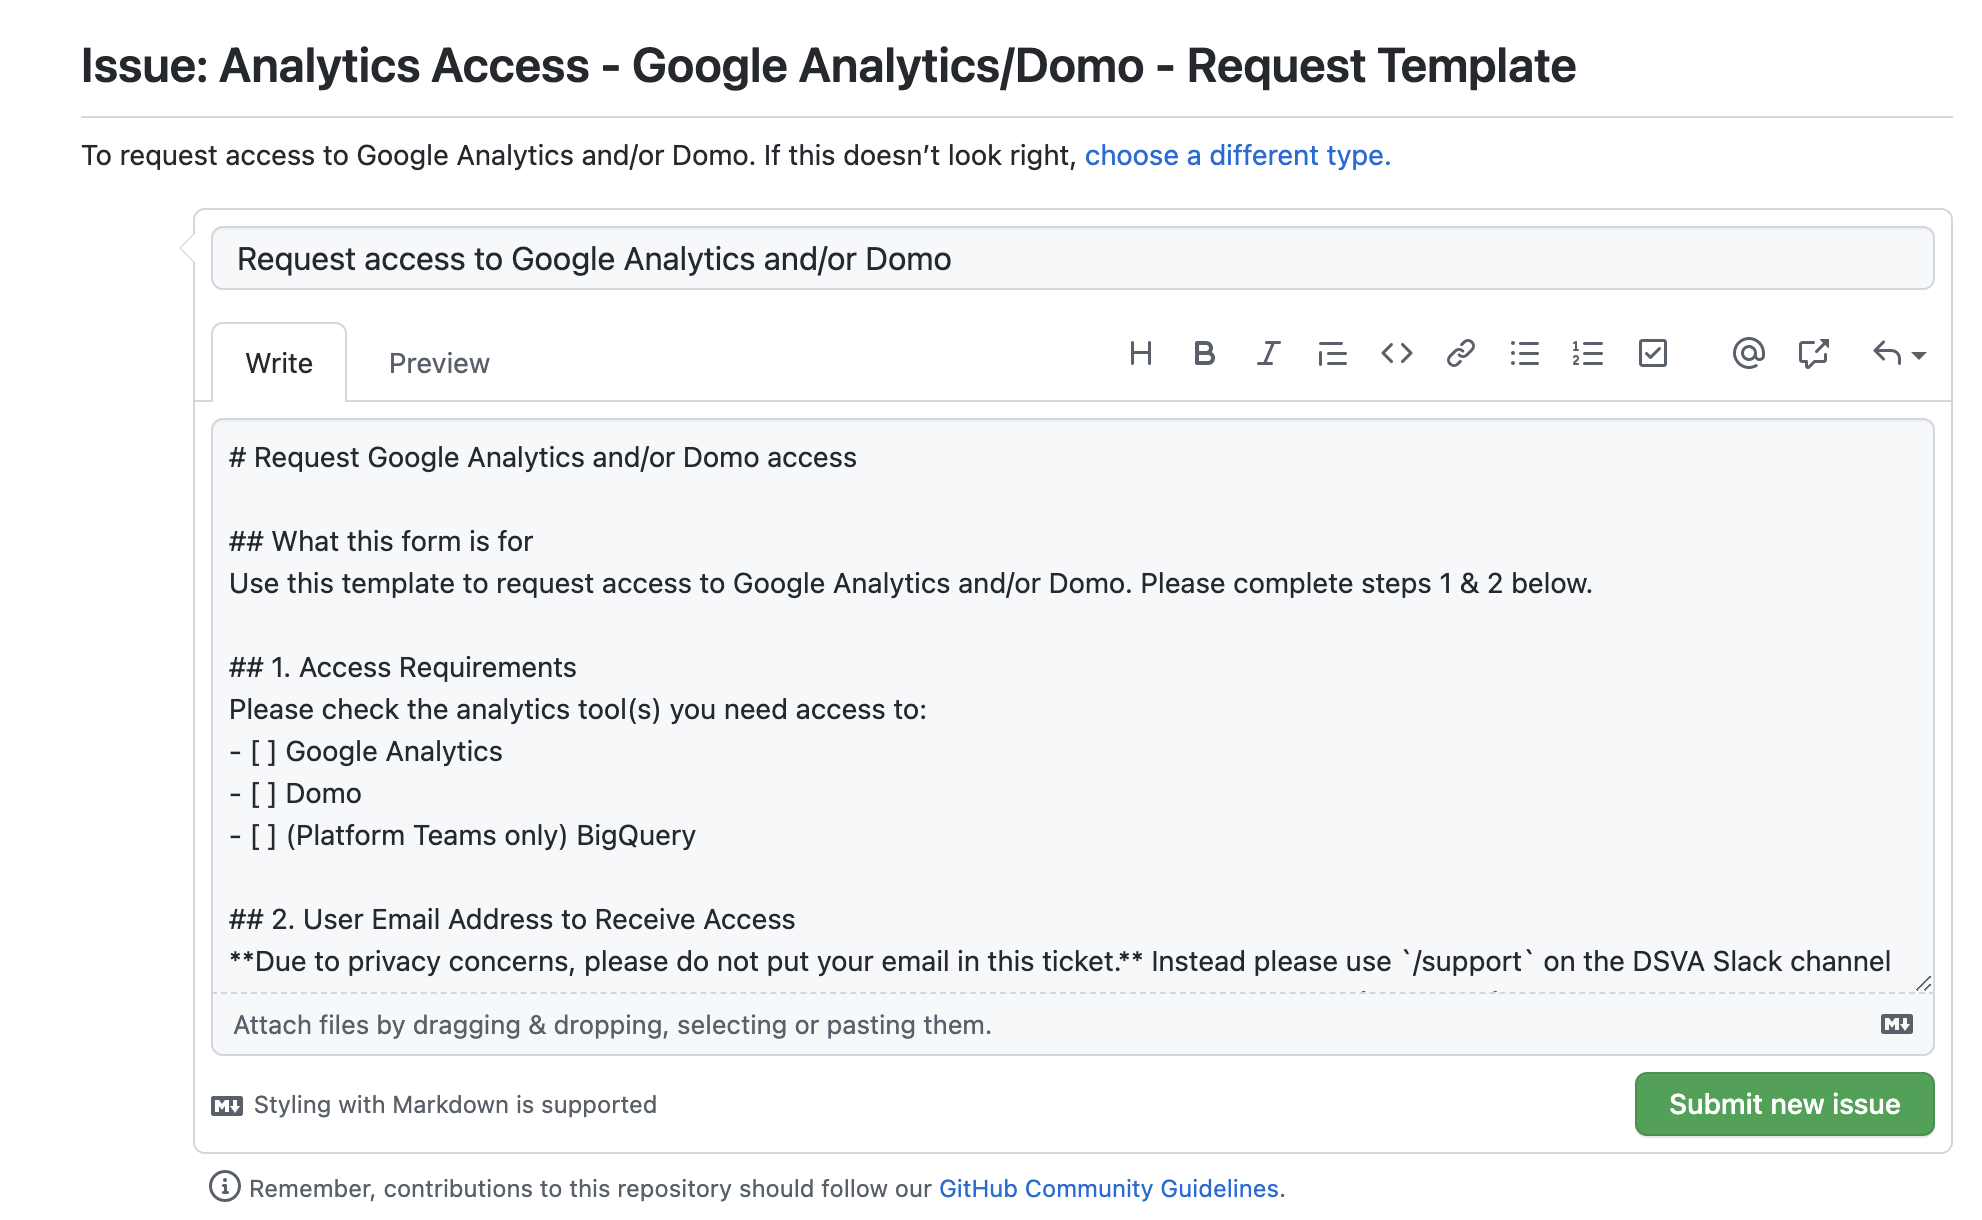
This is what the issue template in GitHub looks like. -
Once you create an issue, copy and paste the URL of the issue somewhere safe so you can access it later.
-
Follow the steps in the Getting help from the Platform in Slack process.
-
During that process, when you are told to fill out a form, fill it out so it looks like the image below. Specifically, select the “Analytics & Insights” dropdown, select the “Access Request” dropdown, and type in your email address and the URL of the GitHub issue that you saved.
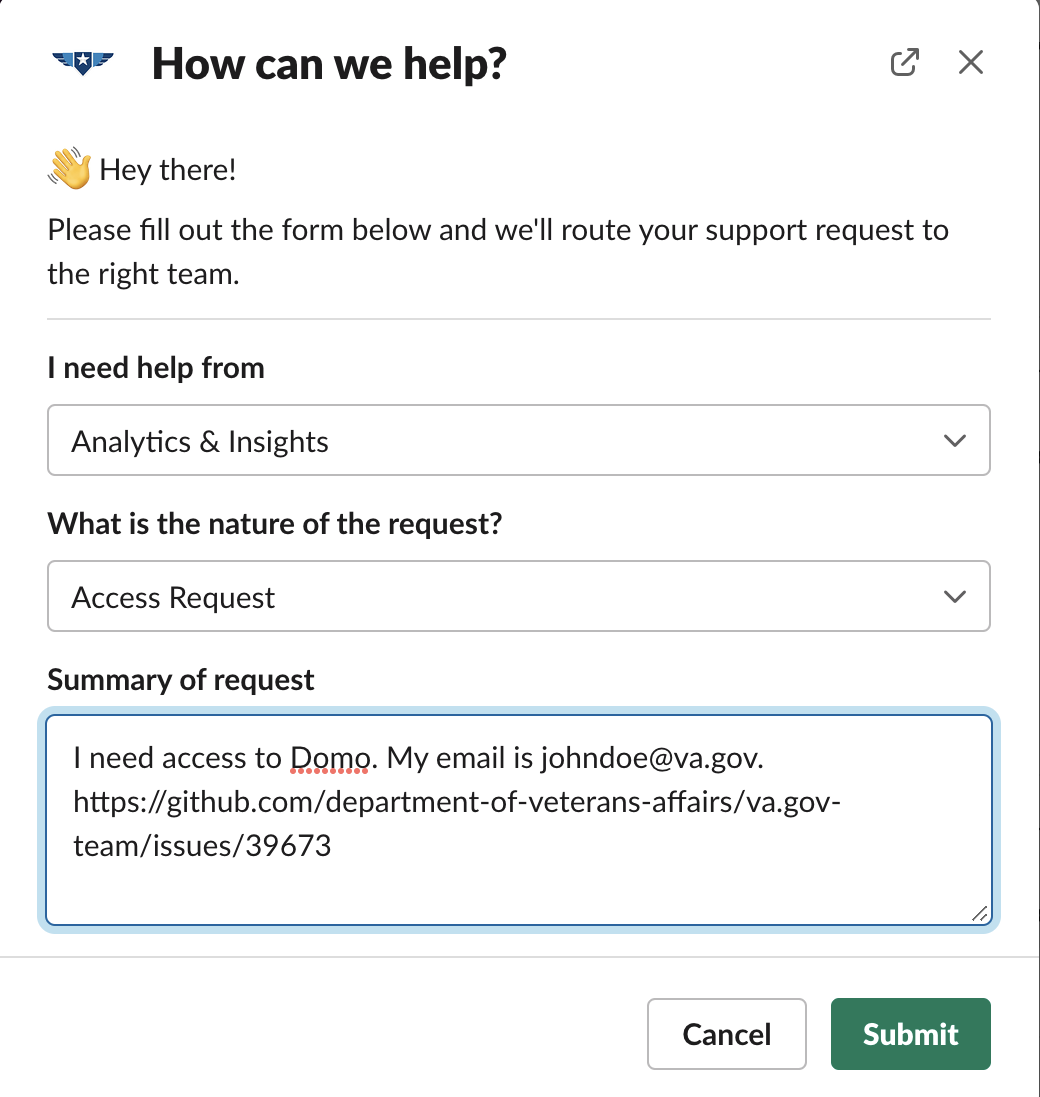
Use this image as a template for how to fill in your request form in Slackunit
-
Request QA Product Dashboard Product List access
Even if you already have a DOMO account, you may or may not have access to the QA Product Dashboard Product List. If you’re in DOMO and find that you don’t have access to this list, click “Request Access” inside DOMO. This request will go through the DOMO messaging system, as opposed to going through Slack.
Submit new feature ideas
If you have a feature in mind that may be helpful for yourself or your team, please create a new issue using the QA Product Dashboard Feature Request template. The feature request will be triaged and prioritized by the QA Standards team.
Data sources
The product directory shows how various product attributes are connected to data sources. Data is displayed in columns.
Critical fields
We’ve identified the following critical fields:
|
UID |
A unique number that’s assigned to each product to be used as a point of reference to link all data sources to the common product name. These will be incremented accordingly by the QA Standards team when a new product is added. |
|
Product |
A common product name that all data sources can share and display on the QA Product Dashboard. This allows for simple filtering and proper representation in our cards in DOMO. |
|
Path |
The path in vets-website where the code lives that powers this product. |
|
Team |
The team that's currently responsible for maintaining this product. |
|
Label |
Corresponding GitHub labels for any issues related to this product. |
|
Root URL |
The frontend URL on VA.gov where this product lives. |
|
Testrail project ID |
The project ID from Testrail that corresponds to tests for this product. |
Blank data fields
If any of these fields are blank for your product, you’ll likely see corresponding data absences on the QA Product Dashboard. Pull requests can be opened to fill this data for your team in the product directory CSV. All pull requests for the product directory must be approved by the QA Standards team to ensure the integrity of the data ingestion of our product directory.
Report data problems
If you notice some data seems off for your product, please reach out to the QA Standards team with a support request in the #vfs-platform-support channel.
Sections and cards
Standards compliance
The QA Standards team has decided on a set of standards that are considered critical QA health measures of a product. The QA Standards Compliance Check card shows the status of your product against these measures. If you see a fail status on your card, it can indicate one of two things:
-
Your product is being measured and not meeting the standard in that category.
-
Your product is not able to be measured via our product directory due to missing and/or inaccurate information.
If you need assistance resolving a failure, please reach out with a support request to the QA Standards team in the #vfs-platform-support channel.
For explanations of what the standards mean, see the expand box below.
QA Standards Compliance Check
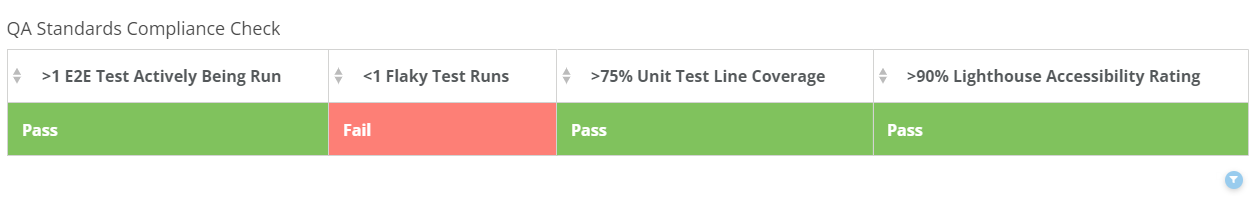
This card shows the current status of your product’s performance against the standards set by the QA Standards team. Failure to reach these measures may indicate a performance problem with the product or failure to notify the team of erroneous code. The standards are defined as follows:
-
>1 E2E Test Actively Being Run - This is measured over 3 days to account for the weekend when we may not have deployments. Regardless of things like single-app deployment, our full E2E suite runs at least once a day, and therefore, results should exist for a test run at least once every 3 days for your product. In addition to no tests existing or our product directory not being accurate to track your tests, this area will also show a failure if all tests are set to “skip” as well.
-
<1 Flaky Test Runs - This is measured over 3 days. Flaky test runs are defined as tests that only fail sometimes, whether it be due to a timing issue, sporadic rendering issue, or other inconsistent variables. If you have a flaky test reported, it means that within one test suite run, Cypress ran the test, it failed, and then on an automated retry, it passed. This indicates that the test only passes sometimes and the test could use some reworking to more reliably pass.
The danger in having flaky test runs is that it could unexpectedly fail a deployment due to tests failing unexpectedly. Our tests should confidently pass if the product is in good shape, and only fail when there is a problem that is needing to be addressed, otherwise, it makes the existence of our tests less effective.
-
>75% Unit Test Line Coverage - This is measured over 3 days. We want to ensure that most of our code is checked regularly for errors. In this case, the unit test coverage report will be looking for 75% of our lines of code to be tested at all times. Not covering the majority of our code with regular testing will leave our products vulnerable to broken features making it into production as automated testing is one of our main defenders of QA on VA.gov.
-
>90% Lighthouse Accessibility Rating - Lighthouse is a tool provided by Google that assesses various aspects of VA.gov. To learn more about Lighthouse, see the section towards the end of this documentation that explains the reports, how they work, and what they mean. Lighthouse is run once daily and your product will be measured as a 3-day average for what it shows as its accessibility rating based on Lighthouse’s criteria (AA WCAG 2.2 as of this writing). All products scoring above 90% ensure that our website is as close to fully accessible to the end-users as we hope to be.
Frontend unit tests
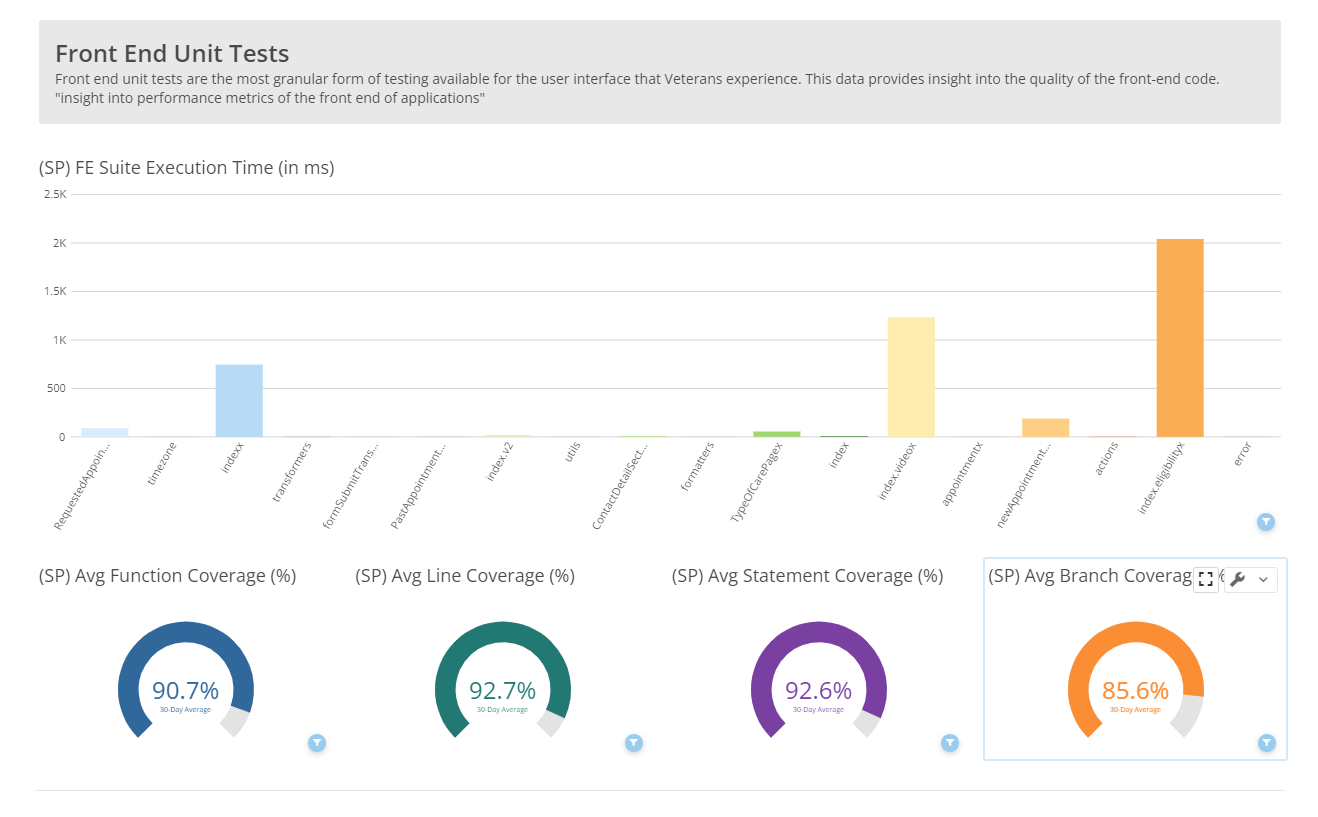
Frontend unit tests are the most granular form of testing available for the user interface that Veterans experience. This data provides insight into the quality of the frontend code. "insight into performance metrics of the frontend of applications".
Our frontend unit tests run every time we push code to vets-website, whether that be a main branch or a feature branch. It’s currently kicked off by our CI workflow and it generates a results file when it’s finished. This results file is then chopped up by the QA Dashboard data repository, uploaded to BigQuery for storage, and then queried into DOMO.
FE Suite Execution time (in milliseconds)
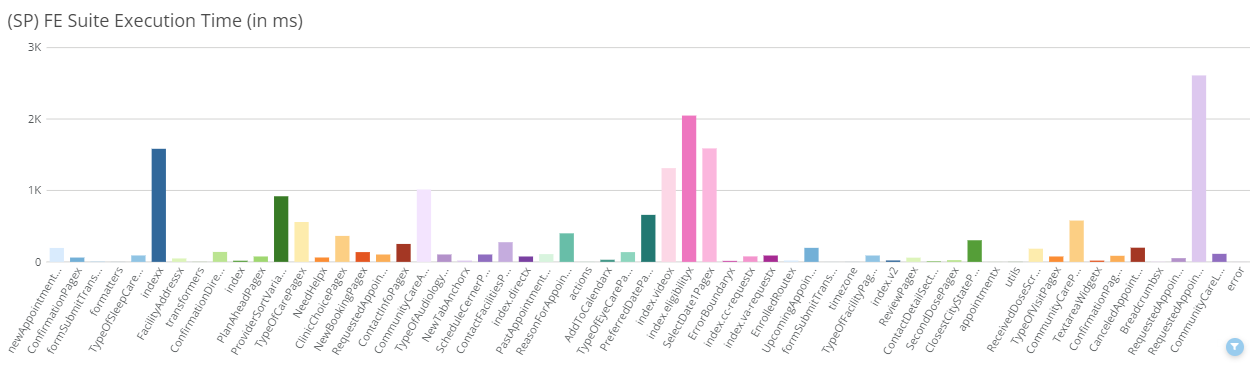
This chart shows the average execution time of the unit test suite for each product. A spike in execution time could indicate that something is not functioning right with our application. A test suite with a similar number of tests to another, that runs slower than another, may indicate tests that are not written efficiently.
This card does not currently support any drill down filtering.
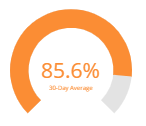
Average Line Coverage (%)
Statements in unit tests refer to “lines of code” in an application. In this chart, a percentage is displayed showing what % of the total lines are being covered by unit test specs. The difference from 100%, would indicate the percentage not tested. The default view for this card shows a 30-day average of the data.
The drill down view of this card will show the total number of lines covered vs the total lines that exist in a bar graph. This chart reflects a minimum standard of 75% of lines of code covered.
Average Statement Coverage (%)
Statements in unit tests refer to “blocks of code” in an application. In this chart, a percentage is displayed showing what % of the total blocks are being covered by unit test specs. The difference from 100%, would indicate the percentage not tested. The default view for this card shows a 30-day average of the data.
The drill down view of this card will show the total number of statements covered vs the total statements that exist in a bar graph.
Average Function Coverage (%)
Functions in unit tests refer to functions that are defined in an application’s code. In this chart, a percentage is displayed showing what % of the total functions are being invoked in unit test specs. The difference from 100%, would indicate the percentage not tested. The default view for this card shows a 30-day average of the data.
The drill down view of this card will show the total number of functions covered vs the total functions that exist in a bar graph.
Average Branch Coverage (%)
Statements in unit tests refer to conditional statements (such as if/else) in an application. In this chart, a percentage is displayed showing what % of the total branches are being covered by unit test specs. The difference from 100%, would indicate the percentage not tested. The default view for this card shows a 30-day average of the data.
The drill down view of this card will show the total number of branches covered vs the total branches that exist in a bar graph.
End-to-end tests
End-to-end (E2E) test data tells us how well a product's end-user experience is being evaluated as part of the continuous integration workflow.
Our end-to-end tests run every time we push code to vets-website, whether that be a master branch or a feature branch. It’s currently kicked off by our CI workflow and it generates a results file when it’s finished. This results file is then chopped up by our QA Product Dashboard data repository, uploaded to BigQuery for storage, and then queried into DOMO.
E2E Tests Exist For This Product
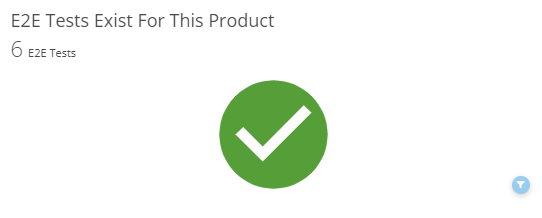
This chart shows a green checkmark if E2E tests exist for this product, and a red X if they do not. A red X may not necessarily mean tests don’t exist, but also that we may not be able to track them based on the information in our product directory. This card is a reflection of our standard of having at least one E2E test.
There is no drill down view for this chart.
Executions Per Day (AVG)
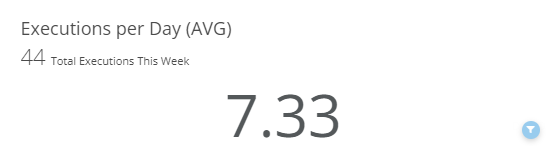
This shows how many times per day, on average, your product’s E2E suite is running. This is a contextual card meant to provide some additional insights into the other E2E cards. If you see executions here, but do not see any pass/fail data in the pass/fail card, your test suite may be running but your actual tests may be flagged to be skipped. This would also typically be paired with a red X in the E2E Tests Exist card.
There is no drill down view for this chart.
E2E Test Flakiness
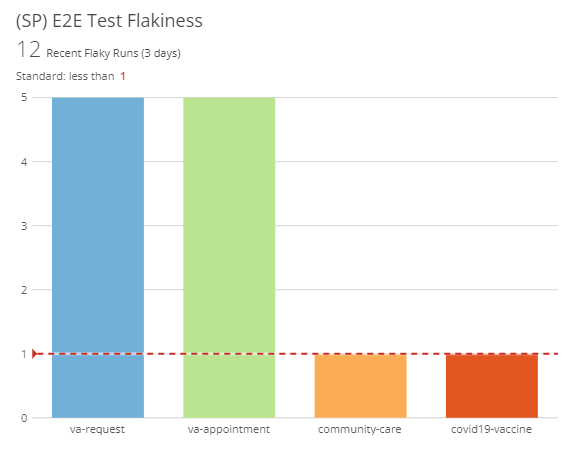
This chart shows the total number of flaky runs of a test. Our tests as we have them configured will retry twice for a total of 3 attempts if they fail, before declaring a test a failure as its final status. A flaky test is defined as a test that only fails sometimes, but also passes sometimes. We have set up tracking where if a test runs more than once (it was retried) but it is still listed as a pass, we count it as a flaky test. We track the total number of occurrences, as an average over time would not show a new issue. The goal of tracking test flakiness would be to be more proactive about addressing test failures before any tests become blockers for multiple users.
This card has an additional drill down view that can be accessed by clicking on the card to break down the flaky runs by spec. This chart reflects our standard that there should be no flaky tests in our products to ensure stability.
Total Pass/Fail over 3 days
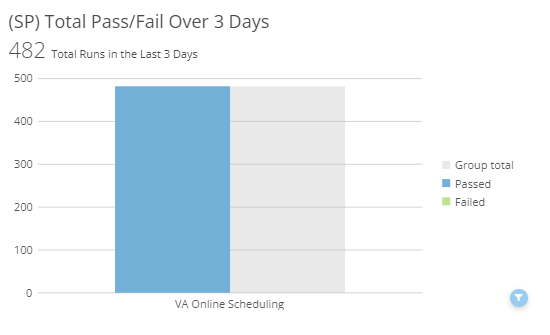
This chart will show the total number of passes and failures that have occurred over the most recent 3-day period. Additionally, for context, there is a summary number of how many total runs have taken place in the same 3-day window.
This card has an additional drill down view that can be accessed by clicking on the application name to break down the pass/fail totals by spec.
Average Product Test Suite Execution Time
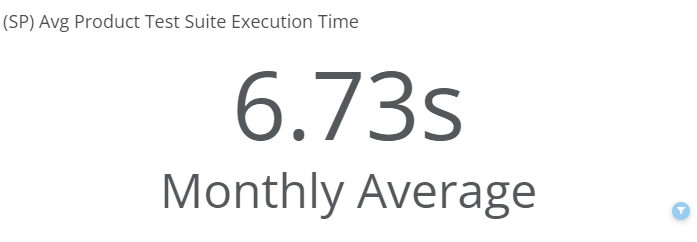
This chart shows the average execution time of the suite of tests for a product. A non-standard deviation in this execution time could be indicative of one of two things: Either a test may be inefficiently written, or, the piece of the site that is being tested by our test may be performing slowly. Having indicators of the latter, particularly, will help us clean up poor user experience issues before we have to wait for a large number of users to report the issue out of frustration.
This card has an additional drill down view that shows the execution time by spec.
Contract tests
Contract test data provides insights to help ensure API and client services can communicate with each other and are receiving the appropriate data at all times.
Our contract tests run every time we push code to vets-website, whether that be a main branch or a feature branch. It’s currently kicked off by our CI workflow and it generates a results file when it’s finished. This results file is then chopped up by our QA Product Dashboard data repository, uploaded to BigQuery for storage, and then queried into DOMO.
Contract Test Spec Execution Time By Product
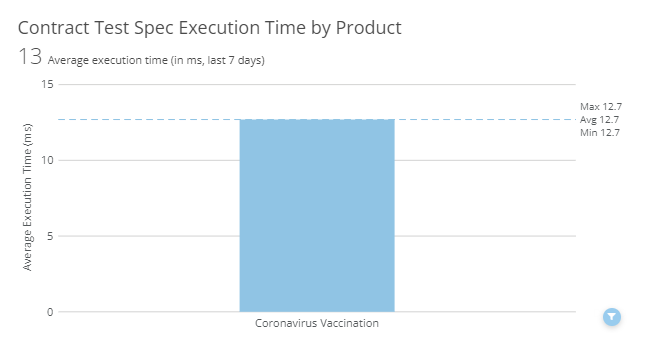
This chart shows the average execution time of the contract test suite for each product. A spike in execution time could indicate that something is not functioning right with our pact broker. A test suite with a similar number of tests to another, that runs slower than another, may indicate tests that are not written efficiently.
This card has an additional drill down view that can be accessed by clicking on the application name to break down the averages by spec.
Contract Test Average Failure Percentage per Product
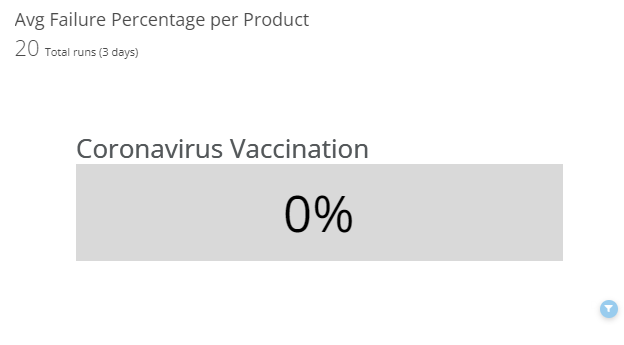
This chart shows the average amount of failures we have per execution of a product’s test suite. If a product is having regular failures, we are likely having an issue with the API interactions for that application and it should be urgently addressed as it may be impacting the application’s functionality. Ideally, if all is well, this graph would show 0 failures (or an average very close to 0).
This card does not currently support any drill down filtering.
Manual functional tests
Execute manual functional tests manually on demand. The QA Product Dashboard collects data from TestRail every day. If you’re doing manual functional testing that’s captured and recorded in TestRail, your data will be incorporated. Data is extracted from TestRail using the TestRail API and loaded into a fairly normalized table structure in BigQuery. DOMO uses the data warehoused in BigQuery to visualize important aspects of participating teams' efforts with manual functional testing.
Number of User Stories Verified by Test Cases
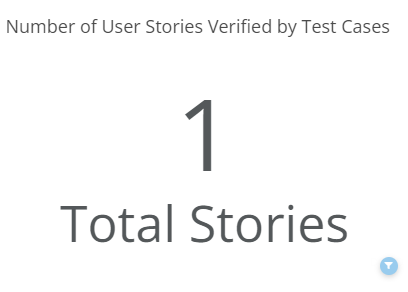
When a manual functional test case references a user story it has acceptance criteria against which it can be tested for correctness. Reference material helps the test case to evaluate functionality for completeness and satisfaction of business needs recorded by the team in the user story. In this way, functionality is far more testable. You can link a TestRail test case to the source material in va.gov-team by using the reference field.
Test Suite Size
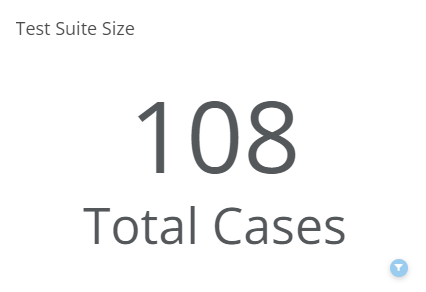
A test suite is a collection of test cases associated with a product. The size of the test suite should not be the sole data point in determining the health of a product’s quality assurance practice. If a product’s test suite is small and many defects are discovered as a result of executing the test suite then it may be prudent to increase the size of the test suite.
Google Lighthouse
Google Lighthouse runs tests daily. When this run is completed, it creates a results file with a “score” for each of its key areas. These scores are gathered along with the date of the run and uploaded to BigQuery. These scores are then queried into DOMO and displayed in our cards. The queries update daily, 2 hours after the time that the Lighthouse scan is scheduled. Google Lighthouse runs daily tests on the VA.gov homepage. Scores are out of a maximum of 100.
Google Lighthouse tests evaluate pages across the four categories below.
Performance
The Lighthouse performance score is based on the speed of the page’s rendering and the performance speed of your application. It breaks apart areas of concern into two categories: Opportunities that could result in faster loading, and diagnostics that focus on application performance. A higher performance number will result in a smoother user experience for our end users.
Clicking in the center of this chart will show a 30-day history as a line graph, so you can see how this product’s performance rating has gone up or down day-to-day.
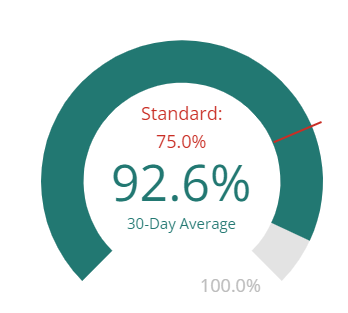
Accessibility
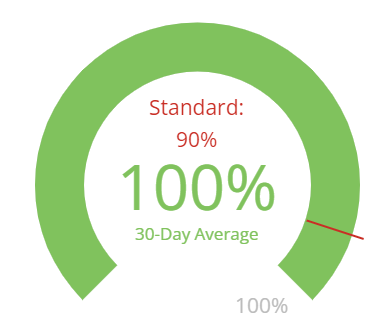
The Lighthouse Accessibility score is a quick accessibility audit that scans for the most common issues based on WCAG 2.2 AA standards. Some common issues that are covered include checking for alt attributes on images, unique ID attributes on active/focusable elements, and background/foreground color schemes having a sufficient contrast ratio. This score dropping at any time could be a quick indicator of an accessibility problem that has snuck into VA.gov. It also acts as a double-check for our custom daily scan.
Clicking in the center of this chart will show a 30-day history as a line graph, so you can see how this product’s accessibility rating has gone up or down day-to-day. This chart reflects our minimum standard of 90% accessibility rating for products.
SEO
The Lighthouse SEO score is a measure of how optimized VA.gov is for search engine results ranking. Things that are checked here include proper meta-tagging, proper descriptive text, and that pages are not blocked from indexing in search engines. A dip in score here means that VA.gov is harder to find than it would ideally be when searched for.
Clicking in the center of this chart will show a 30-day history as a line graph, so you can see how this product’s SEO rating has gone up or down day-to-day.
Best Practices
The Lighthouse Best Practices score focuses on a variety of practices ranging from security to functionality. The best practices scan does the best it can to ensure that all vulnerabilities are closed up and that there are no errors we should be addressing. Any score dips here could represent a future opportunity for a critical error with VA.gov.
Clicking in the center of this chart will show a 30-day history as a line graph, so you can see how this product’s best practices rating has gone up or down day-to-day.
Help and feedback
-
Get help from the Platform Support Team in Slack.
-
Submit a feature idea to the Platform.