

Introduction
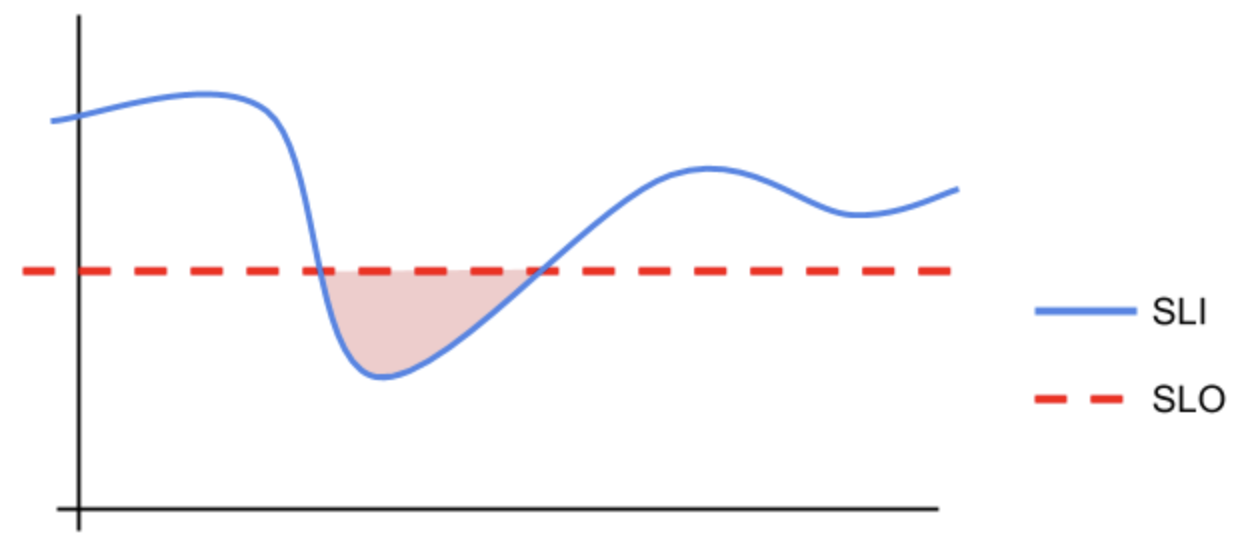
Service Level Indicators (SLIs) measure an aspect of a service whereas Service Level Objectives (SLOs) define what that metric should be. For example, an indicator would measure the actual number of items served and an objective would measure the desired number of items served. You can’t have an SLO without an SLI.
This document defines these indicators and objectives for Vets API which can be viewed on the Platform SLO Status Dashboard.
Summary of SLO Targets
-
Availability: > 99.9%. (Processes are up and responding)
-
% of requests which do not result in an error (HTTP code <500) as sampled by our external synthetic testing tool (Datadog).
-
-
Latency: < 750ms/request
-
Response time as gathered by our server-side application.
-
-
Errors: < 0.25%
-
% of requests which result in an error (HTTP code >=500) as gathered by our server-side application.
-
-
Utilization: < 80
-
Percentage of requests vs total request capacity as gathered by our application web servers (puma).
-
(Metrics are averaged over the previous rolling month.)
SLO Targets
Availability
Availability across all endpoints can be complex. Focusing on Vets API, we have the overall uptime of the API, the uptime of each API endpoint, and the uptime of external services.
How do we ensure an accurate metric is being defined? If the API is up but third-party services are causing timeouts what is the uptime of the API? This gives us multiple uptime metrics to track.
This metric is unique as it is sampled and recorded externally. It provides additional insight that internal metrics cannot.
|
SLI |
SLO |
Notes |
|---|---|---|
|
Vets API Uptime |
99.99% uptime averaged over a rolling year |
Simple Uptime of the API, not including failures caused by third-party systems. |
|
Vets API Perceived Uptime |
99.9% average over a rolling year |
This would include third-party systems in any case where something failed upstream or timed out and wasn’t handled gracefully. The user perceives we are down with no idea why. |
Errors
The rate of requests that are returning an HTTP status code >= 500 (e.g. 500, 504, 522
|
SLI |
SLO |
Notes |
|---|---|---|
|
Vets API Error Rate |
Our average error rate (500s) must be below 0.25% or 99.75% of requests should not error. |
This is all requests that do not result in the expected outcome. Gracefully handled upstream errors that cannot be reduced can be removed from this metric over time. |
Latency
Latency can be understood as the time it takes for the backend to respond to the client, but that path includes all incremental hops that occur between the application and the user (the time to retrieve back-end services and time spent in proxies and gateways).
The perceived latency is also a product of all the assets loaded that may not be served by the primary backend service. The complexities of our ecosystem, our multi-tiered assets, and network gateways make latency a non-trivial calculation.
|
SLI |
SLO |
Notes |
|---|---|---|
|
Vets API Latency Average latency |
We have chosen 750ms as the starting target.
|
This is a measurement of endpoint response latency from the Vets API endpoint. |
Utilization
Throughput metrics are often used to assess the necessary and sufficient scale for an endpoint or to provide schemes for partitioning endpoints. For example, we might define SLI as the amount of time that the request rate for a specific endpoint is over a given threshold. This value can vary widely based on the expected latency of a given endpoint and it might not be very practical to start there.
In the case of Vets API, we have discussed beginning by creating an SLI around the Request Utilization. Puma’s capacity metric allows us to calculate this. Puma is the web server that sits in front of the Vet-API endpoints. This should give us an SLI to track throughput for each application node.
|
SLI |
SLO |
Notes |
|---|---|---|
|
puma.capacity vs puma.max_threads |
What is the acceptable average utilization over a given period? We’re starting with average request utilization of <80. |
Given the nature of our system with long-running external requests, we may want to set this low to ensure we help recognize when horizontal scaling is an appropriate solution to overcome third-party latency. |
Future SLO Targets
-
Skew: The expected vs actual start time for background processes, queuing services, and synchronous tasks.
-
Reliability Score: A combination of proposed SRE requirements for teams such as observability, delivery, and governance. SLOs would track the improvement and consistency of this score.
-
Coverage: Code coverage should be above 90%. Tracking this across repos should be achievable through publishing mechanisms available in GitHub Actions.
Principles for defining our SLOs
-
Guided by the Four Golden Signals
-
Simple, achievable, and easily monitored
-
Will be adjusted over time
-
Understandable by stakeholders
-
Tracked both globally and per endpoint
Related Resources
-
Platform SLO Dashboard (Datadog): Summary view of current Platform SLOs
-
Vets API Dashboard (Data Dog): The current SLO-targeted engineering dashboard
Help and feedback
-
Get help from the Platform Support Team in Slack.
-
Submit a feature idea to the Platform.