

Workflow Functionality
With GitHub Actions, we can create workflows, which are pipelines or automated processes that can be triggered by a variety of events.
Workflows are made up of jobs, which are sets of steps or commands, representing tasks such as building and testing.
The workflows you may find relevant are the "Continuous Integration" and "Pull Request" workflows.
Continuous Integration workflow
This workflow runs whenever changes are pushed to a branch. No matter how many commits you make locally, the workflow only gets triggered on push.
It's responsible for typical CI processes, consisting of jobs such as building, testing, and deploying.
It also has a job that lints files across the entire repo. For PRs, this gets skipped in favor of the linting job in the "Pull Request" workflow, which only lints files changed.
Pull Request workflow
This workflow runs whenever a pull request is created or commits are pushed to a pull request.
Its jobs run certain checks on changed files, including:
-
Linting only files changed, which differs from the "Continuous Integration" linting that runs on all files in the repo
-
Raising concerns when Sentry calls are made in case PII is mistakenly included in the report
-
Reminding that icons should have ARIA attributes when they are interactive
-
Double checking whether disabling ESLint rules is completely necessary
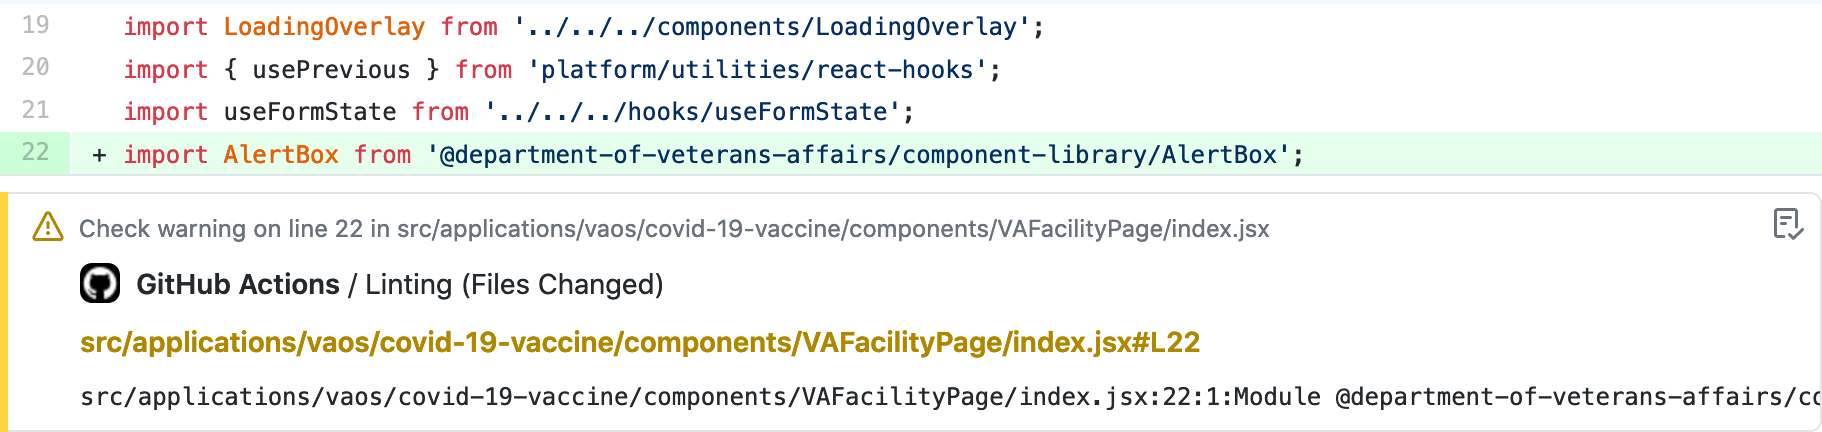
When issues are detected, these checks annotate or comment on the relevant sections of code.
Daily Production Deploy workflow
This workflow runs at a specific time daily and is less relevant to the standard development process. More detailed information on this workflow can be found in the Deployments documentation.
Workflow Statuses
Viewing all workflow statuses for a commit
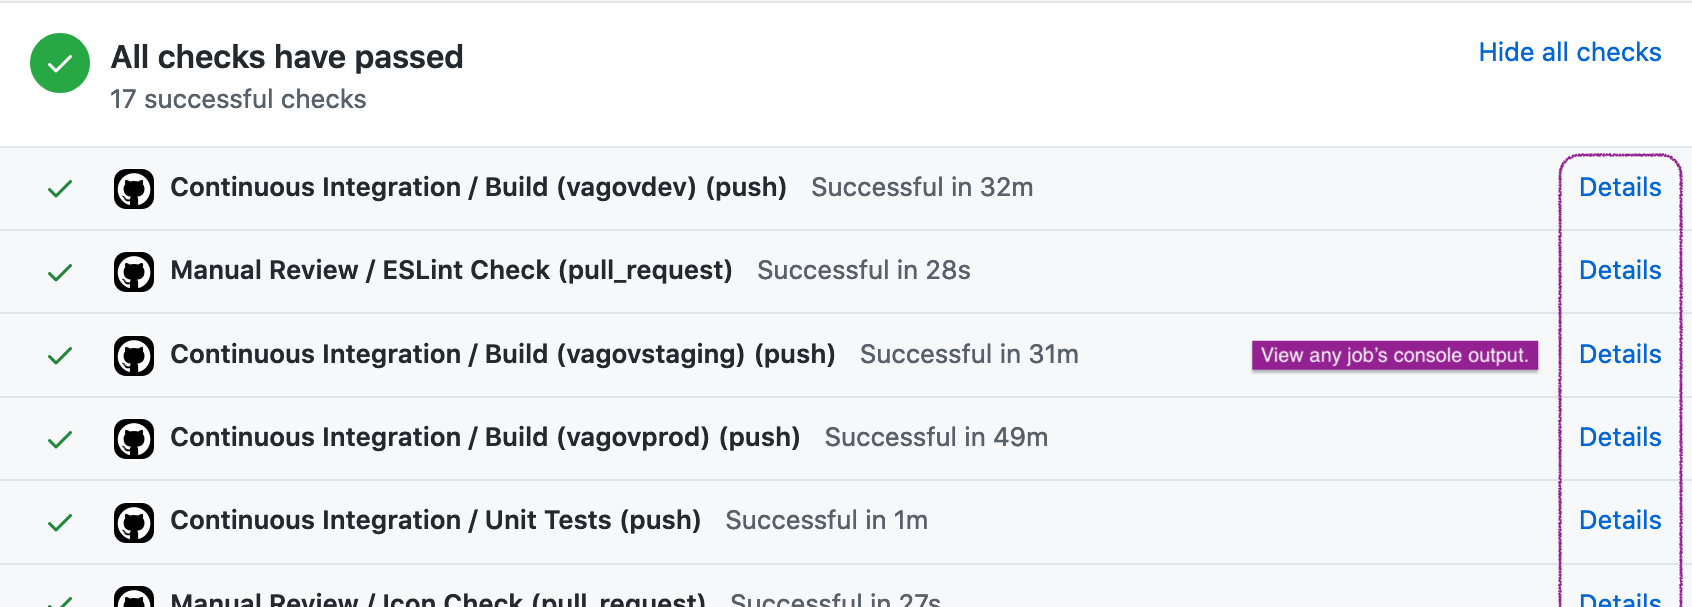
Pull requests
Pull requests display status checks at the bottom of the page. Click on "Details" of any job to view its console output.
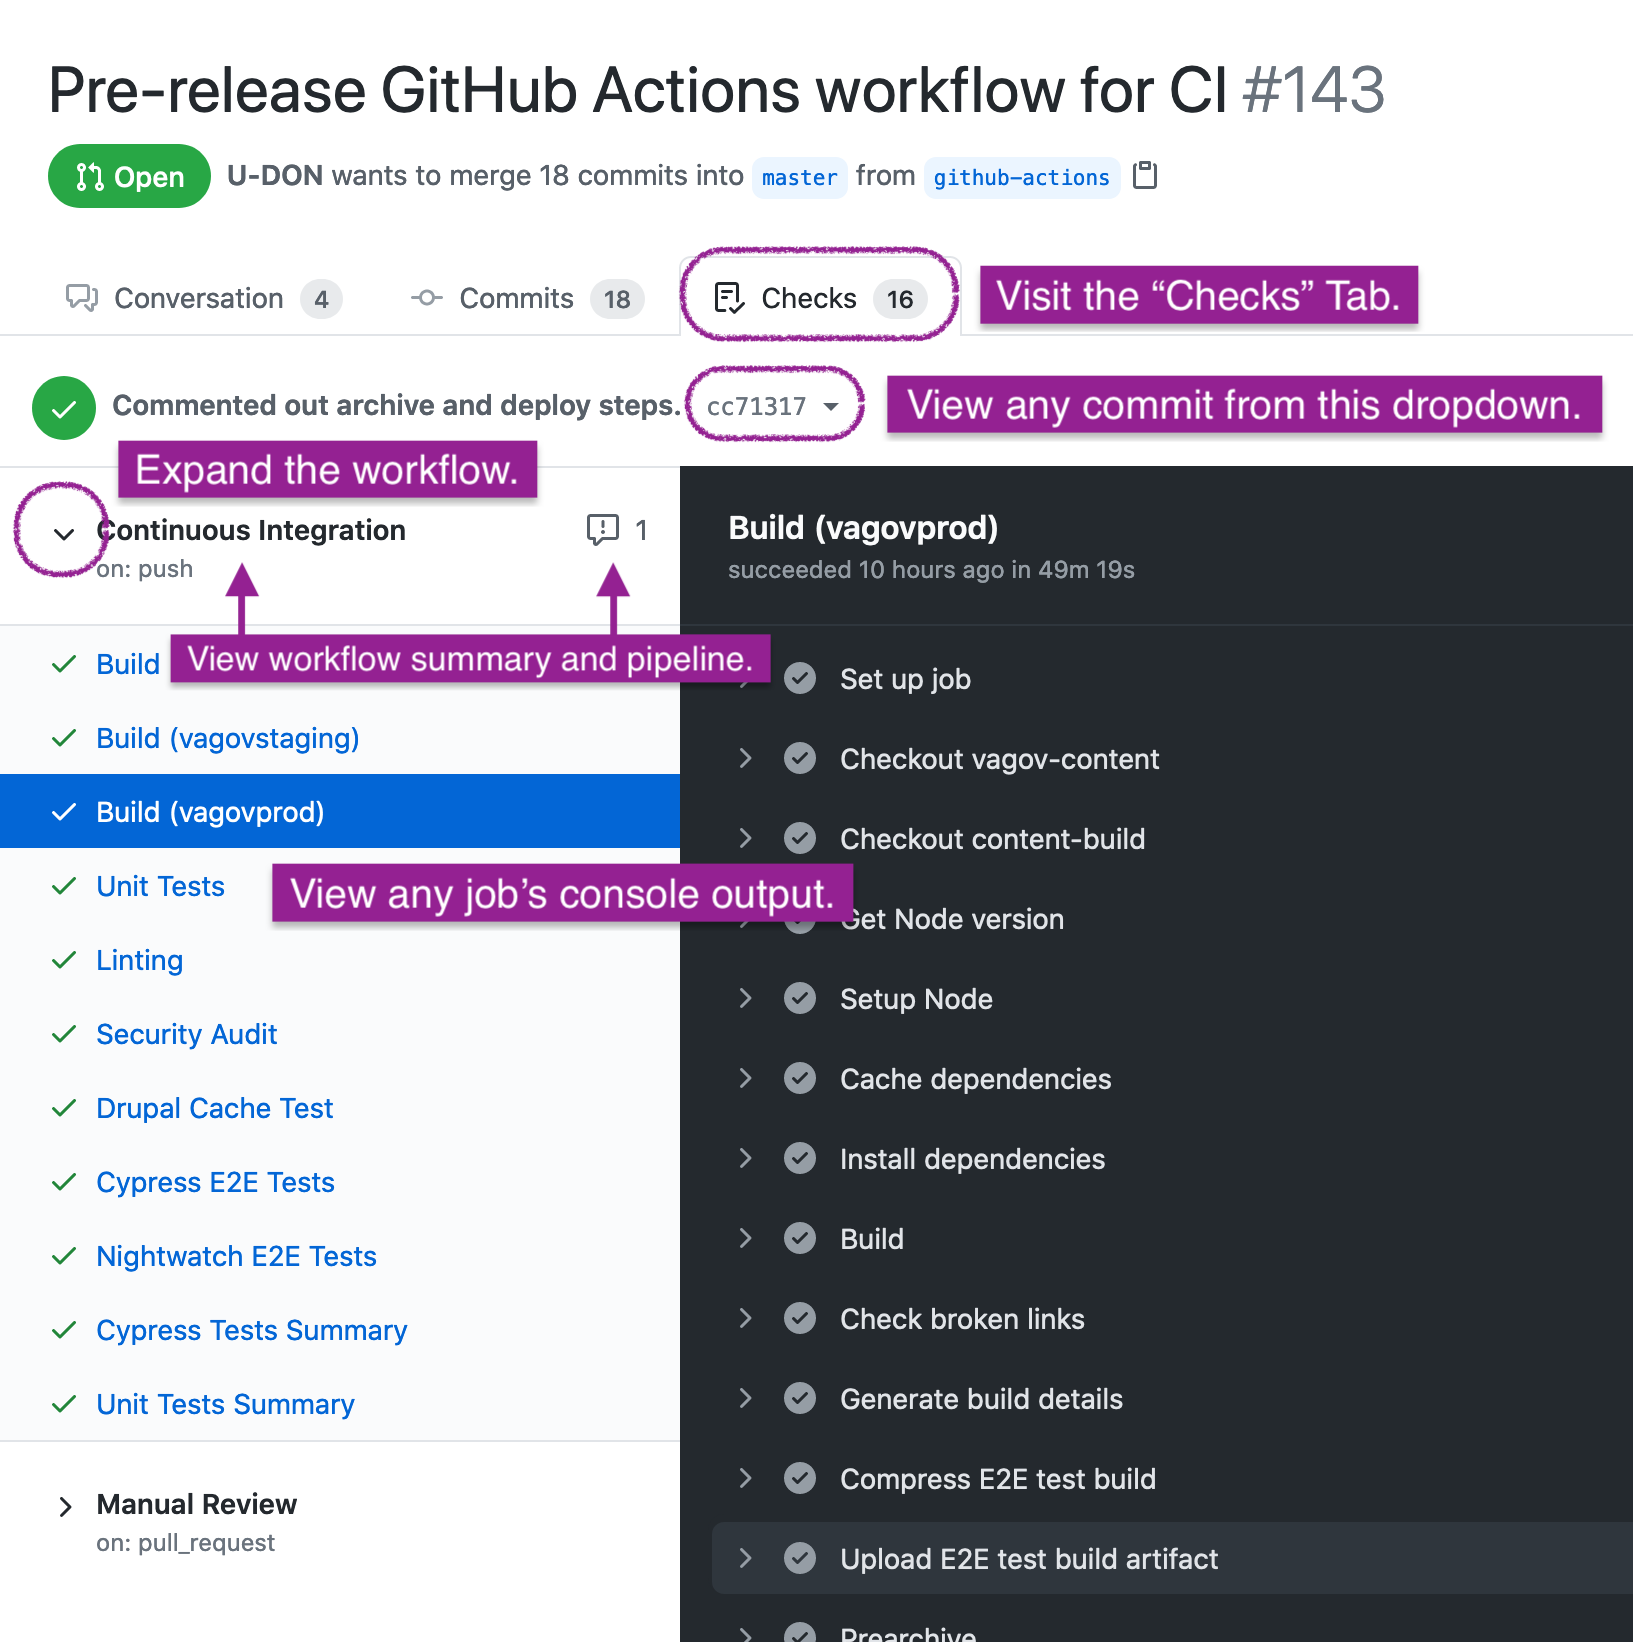
Alternatively, directly navigate to the "Checks" tab. To view a particular job's output, expand the workflow that contains it by clicking the chevron.
To view workflow statuses for previous commits in the PR, select a commit from the commit hash dropdown.
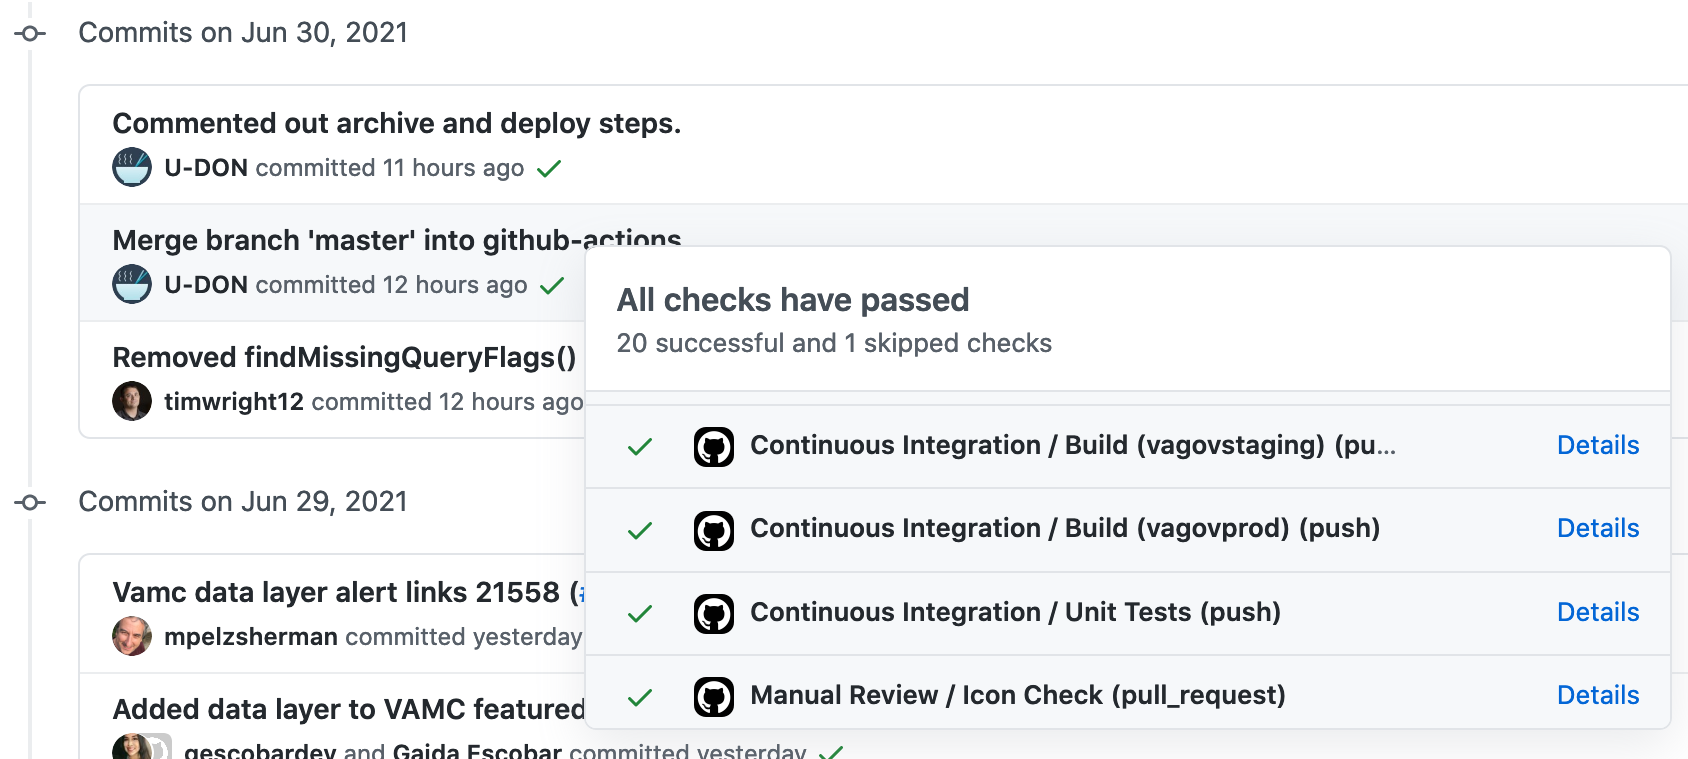
Commit statuses
Commit histories show icons to indicate the overall status of a commit.
Click on the icon and then click on "Details" of any job to view its console output.
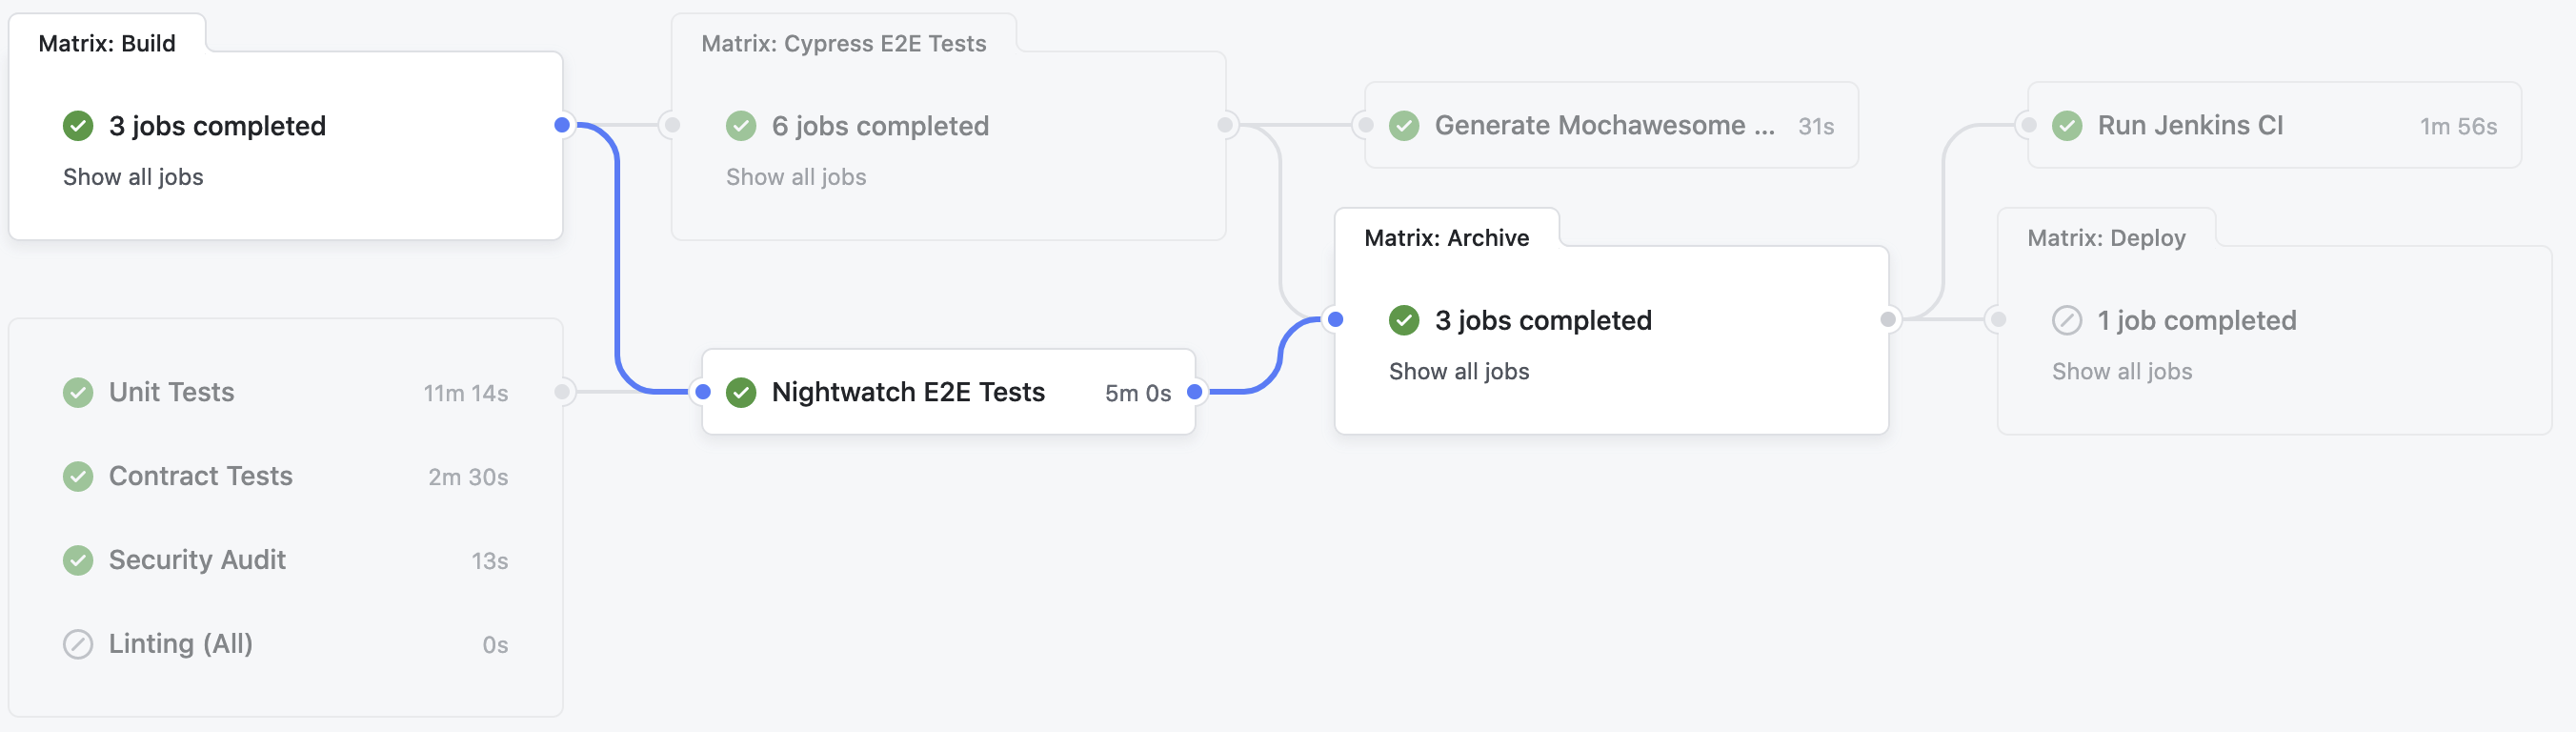
Viewing the summary and pipeline visual for a workflow run
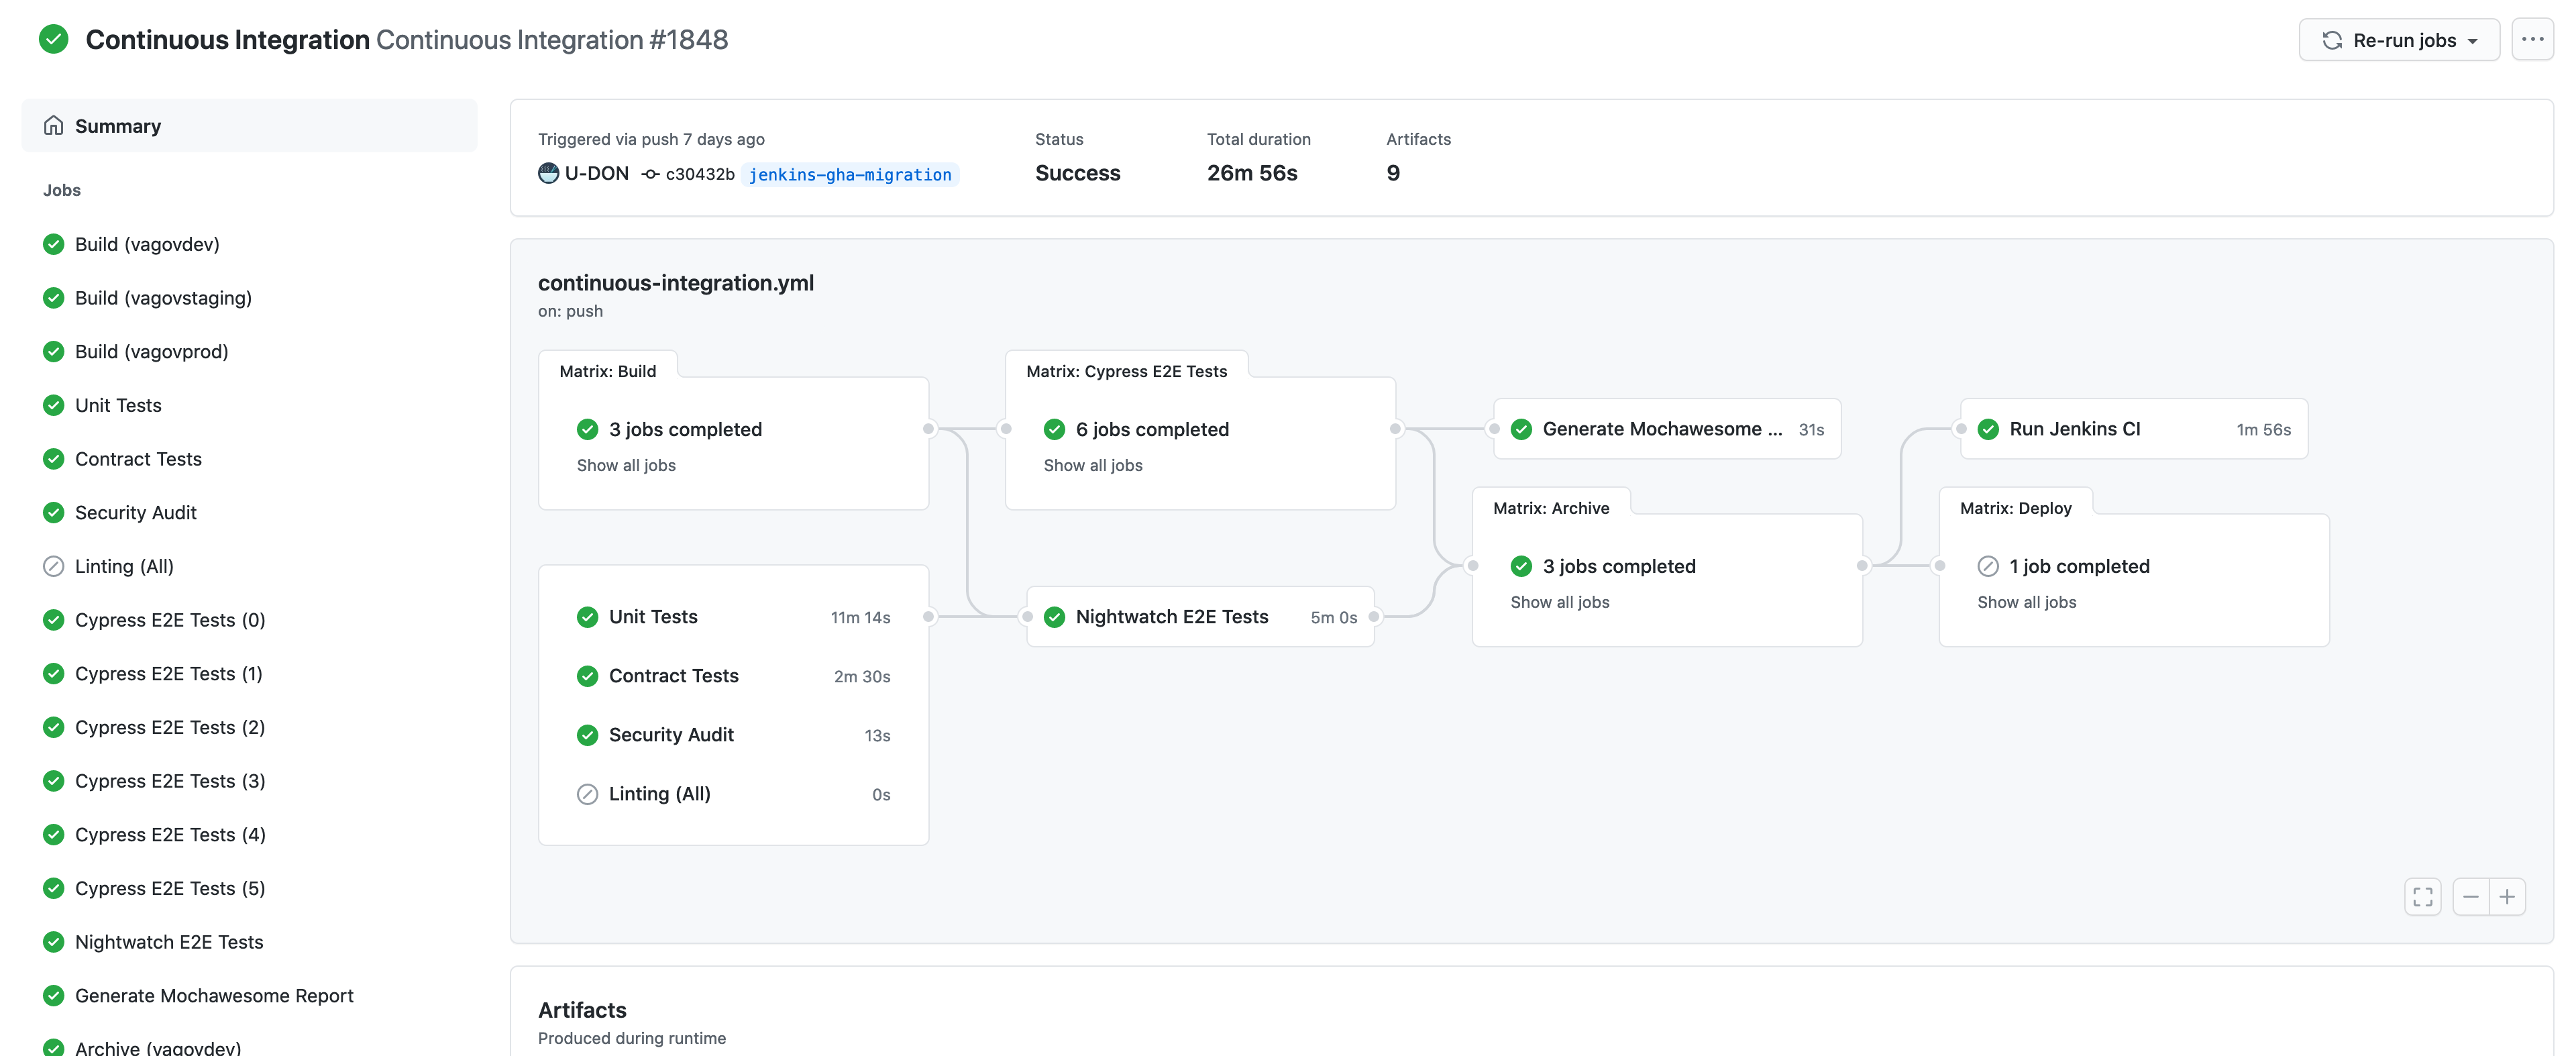
Every workflow run has a summary page where you can see a graph of the pipeline to track its progress.
Each box or node in the graph represents a job or matrix of jobs with an icon to indicate status (pass, fail, skipped, in progress).
To get to this page, navigate to the view with the job console outputs and click on the workflow name or annotation icon.
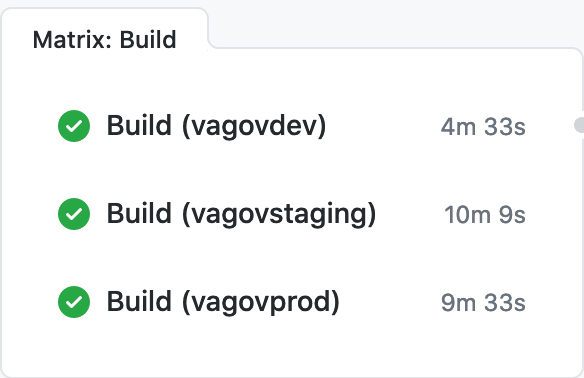
Matrix jobs
A matrix represents a set of jobs that all run the same steps with some variations depending on certain variables.
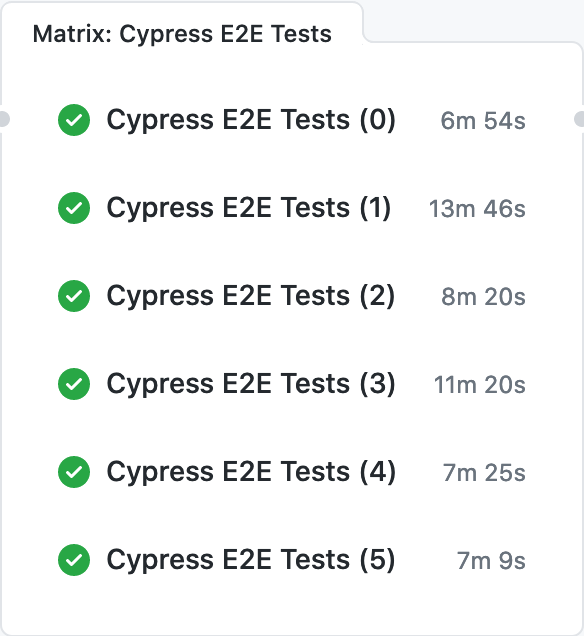
Click on any matrix in the graph to expand and view the jobs in it. The job names indicate the variations in parentheses.
Build for each environment
Cypress tests split into smaller batches
Job dependencies
Lines between jobs indicate dependencies. The order of execution is left-to-right; jobs on the right of the line depend on and run after jobs on the left.
Hover over a job to highlight the jobs that it directly depends on and the jobs that directly depend on it.
The lines can sometimes overlap, making the dependency graph unclear. The relationships can be made more apparent by hovering over the relevant jobs to highlight them or clicking matrix jobs to expand them.
Cancelling and re-running failed workflows
In either the workflow statuses view for a commit or the summary page of a workflow run, you may cancel or re-run a workflow.
To cancel a workflow, click the button to "Cancel workflow".

To re-run a workflow that has failed, expand the dropdown to "Re-run jobs" and click the button to "Re-run all jobs".

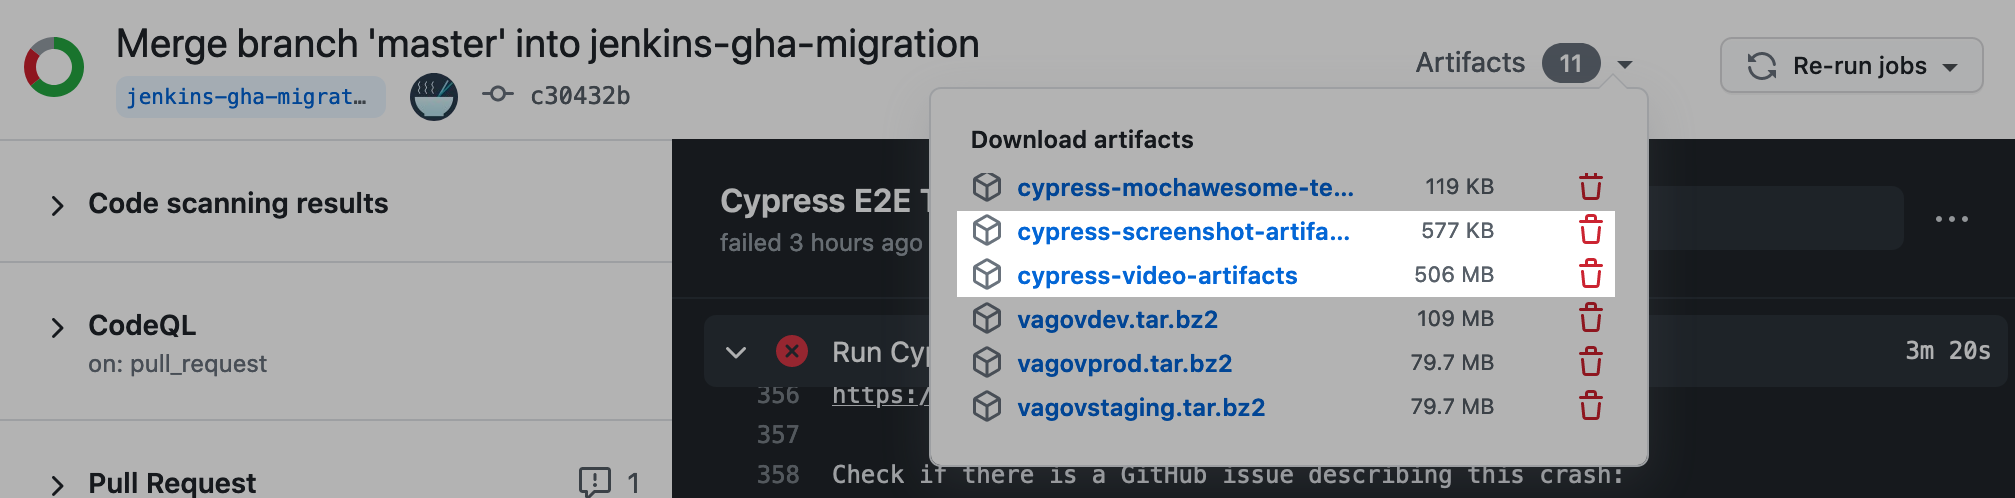
Using the GitHub CLI to interact with workflow runs
You may use the gh command line tool to interact with workflow runs.
|
Command |
Description |
|---|---|
|
|
List recent workflow runs |
|
|
View details for a workflow run or one of its jobs |
|
|
Watch a workflow run while it executes |
|
|
Rerun a failed workflow run |
|
|
Download artifacts generated by runs |
With gh run list, you get a list of the most recent workflow runs and their IDs, which can be passed as an argument to the other commands.
If you don't pass specific IDs, the commands will allow you to pick among a limited list of recent runs. In the case of gh run download, you can choose to download artifacts from the most recent run that had artifacts.
Run gh run view --web to see the workflow run summary in the GitHub UI.
Secrets Injection
If any sensitive information is to be used in a workflow, it should be stored in the AWS Param Store to avoid any secrets being exposed unintentionally. They can be injected using the action marvinpinto/action-inject-ssm-secrets.
Note: Secrets should be minified to avoid unintended behavior. Secrets are processed line by line and those lines are obscured by the GHA workflow in an attempt to keep your information safe. So, for example, non-minified JSON would result in { and } being obscured with ***, as the curly braces are on their own lines so they would be an “exact match” for sensitive characters.
Troubleshooting
In general, you may view the console logs for details about any job execution.
Some jobs provide additional information that may be useful for troubleshooting.
Linting
The linting job in the "Pull Request" workflow annotates any problematic areas in the changed code.
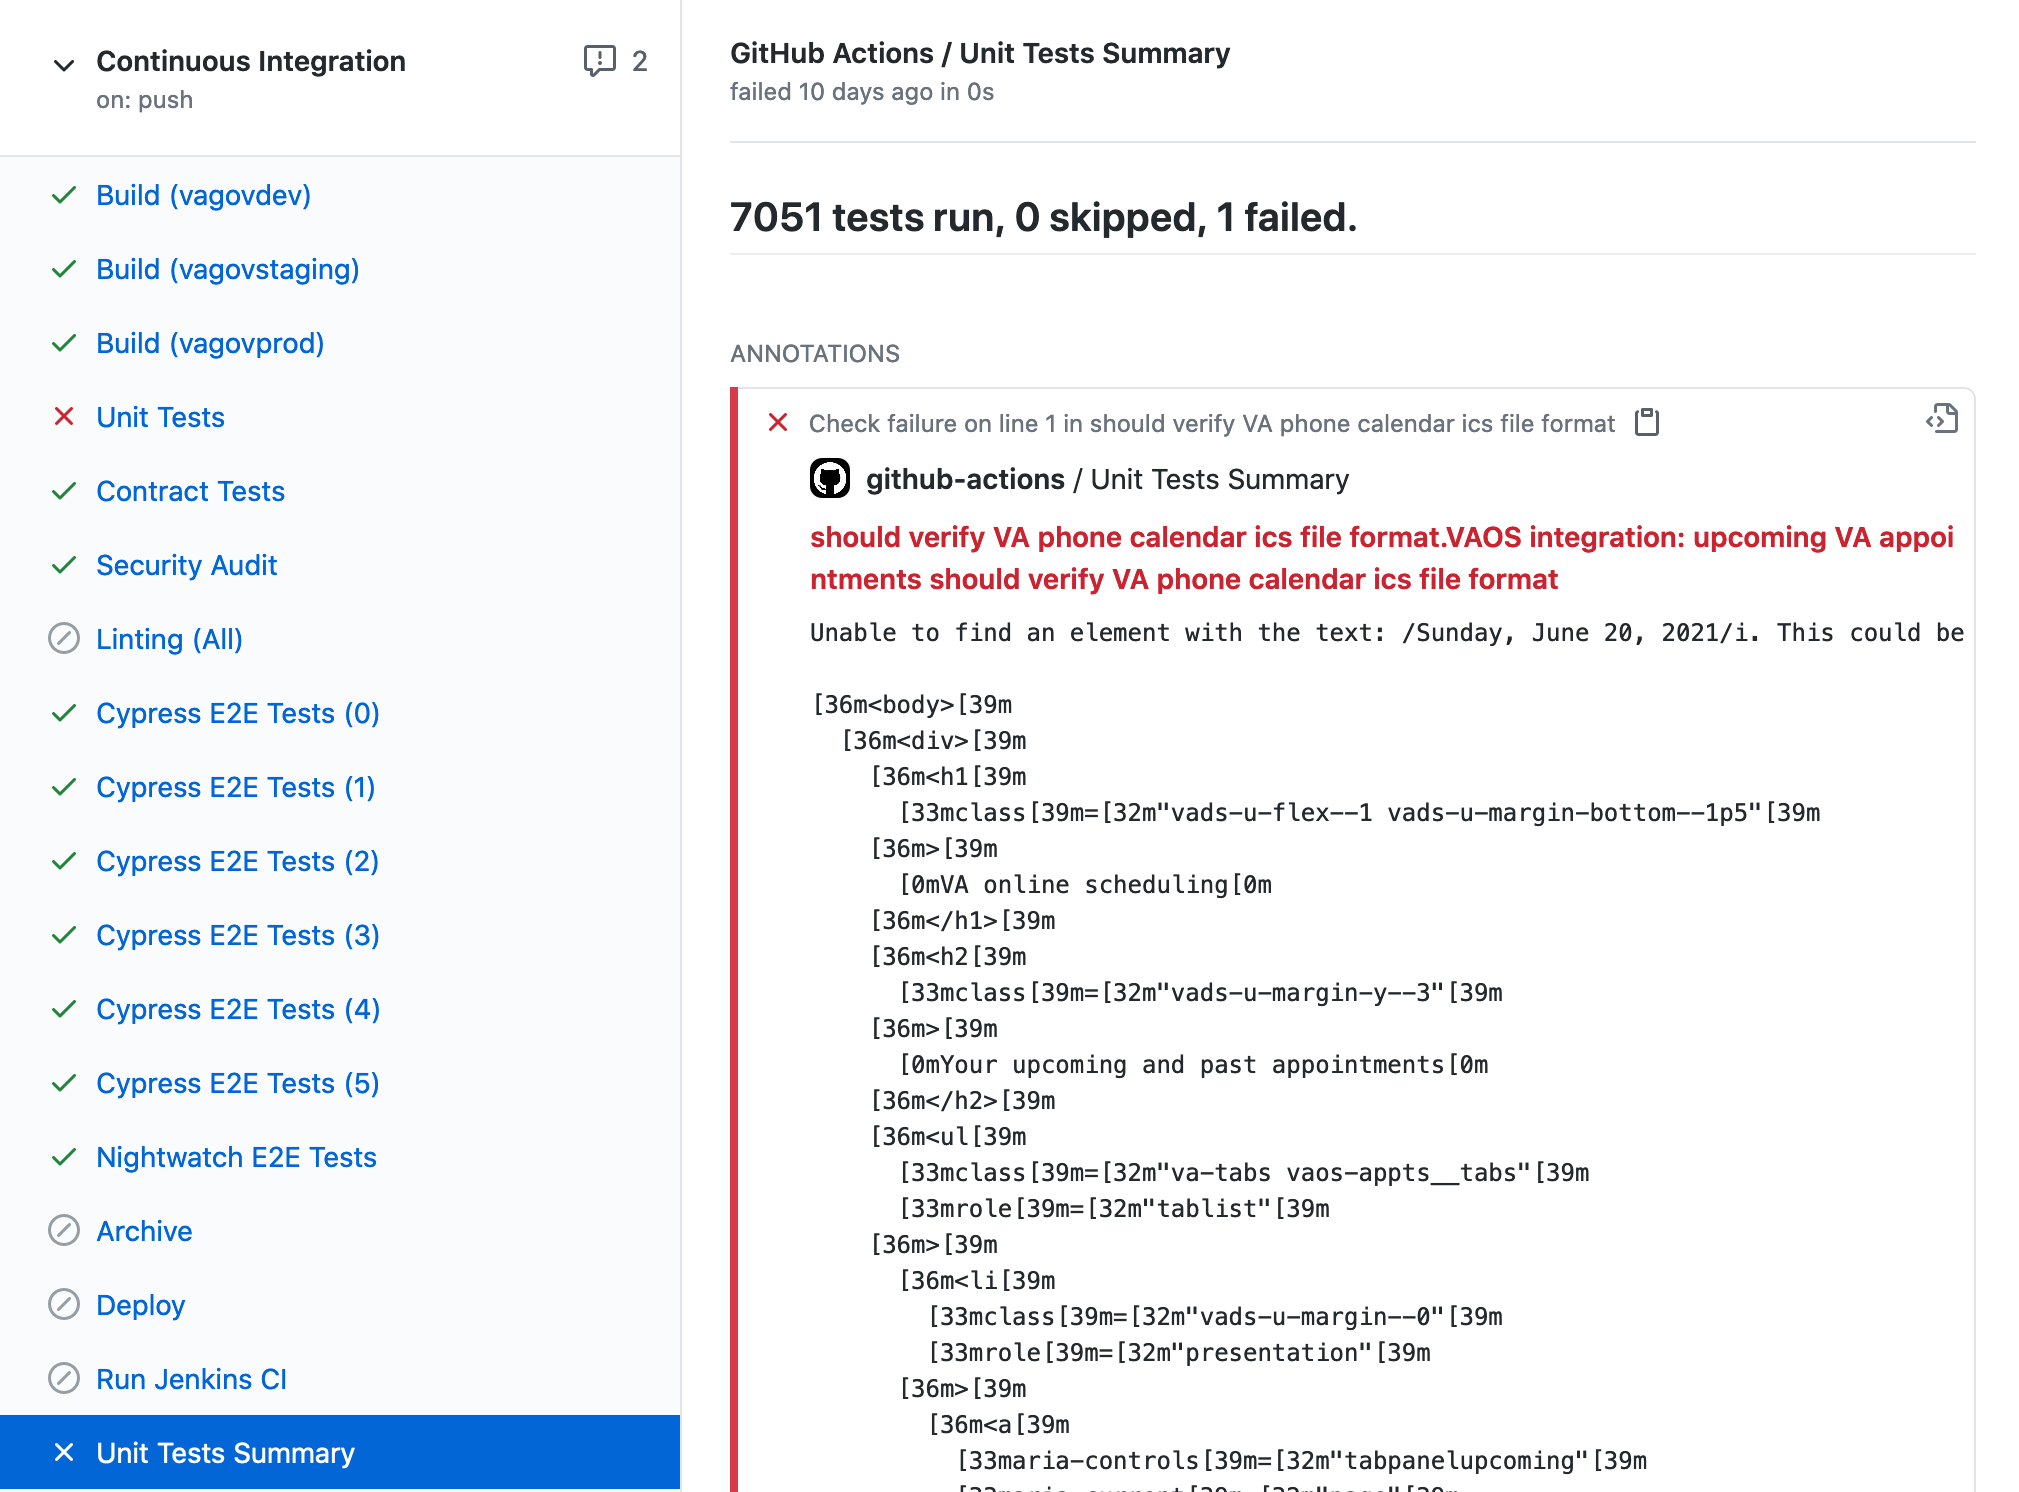
Unit tests
Unit tests produce a "Unit Tests Summary" in the list of jobs under the workflow.
It contains the following information:
-
Number of tests run, skipped, and failed
-
Annotations for any test failures
-
Code coverage report
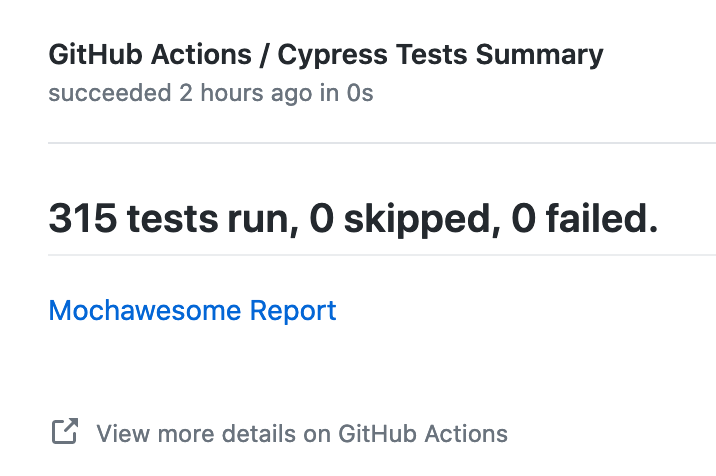
Cypress E2E tests
Cypress tests produce a "Cypress Tests Summary", which is similar to the unit tests summary.
-
It contains the number of tests run, skipped, and failed as well as annotations for test failures.
-
Additionally, there is an external link to a Mochawesome test report, which is more comprehensive.
There are also screenshot and video artifacts generated for any test failures.
Edge Cases
Multiple runs of the same workflow
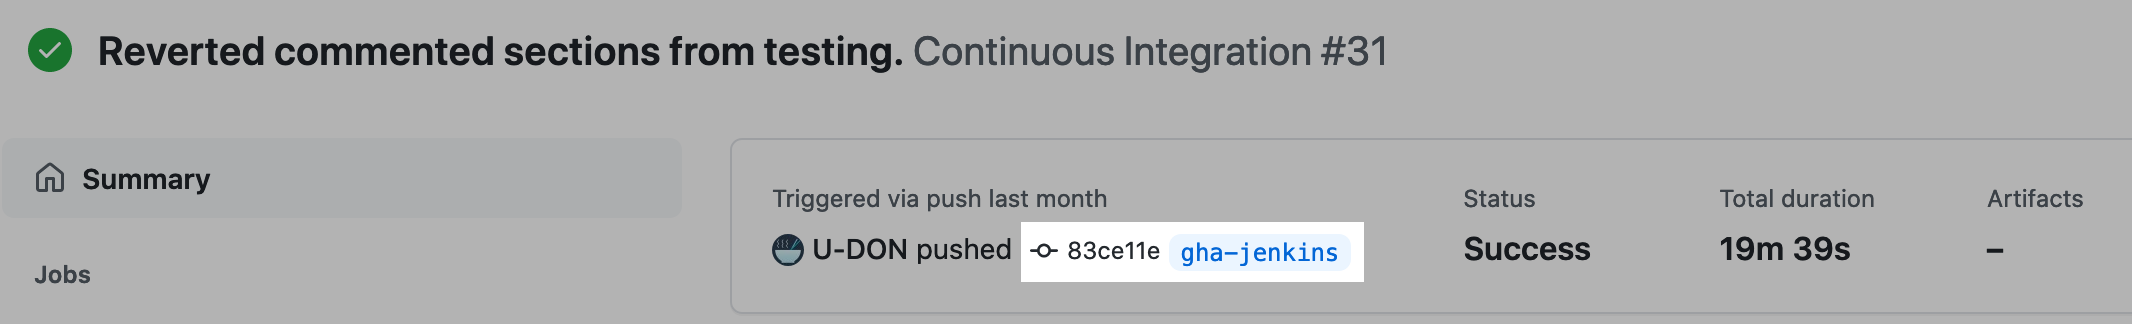
Commits can sometimes show multiple, seemingly duplicate, runs of a workflow (e.g., "Continuous Integration").
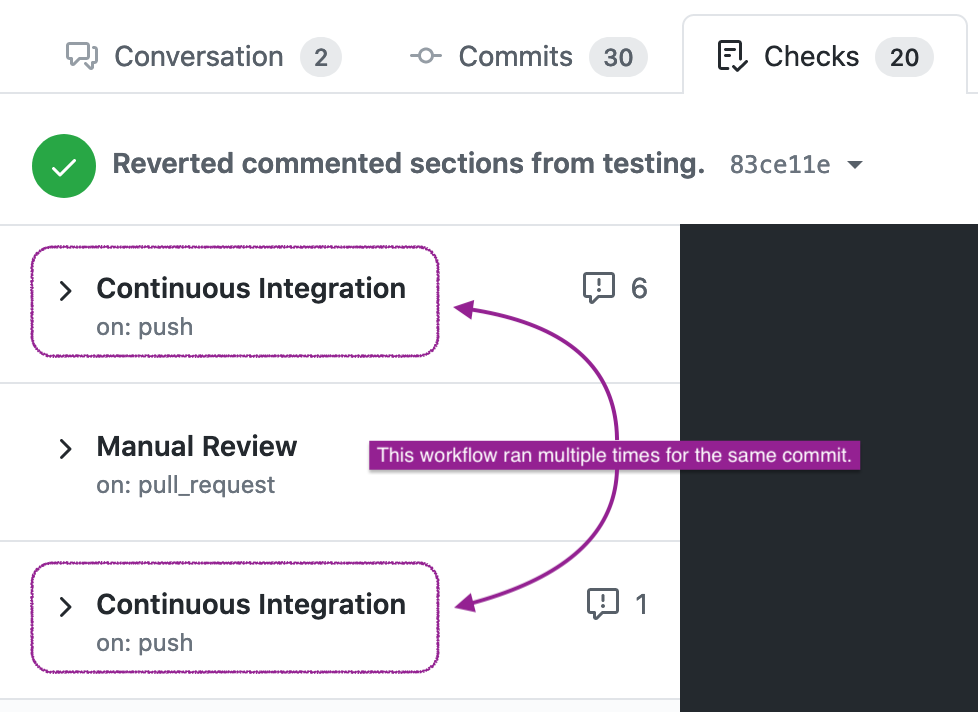
This can happen when a branch is created from that commit and pushed without adding any new commits. As a result, the workflow is triggered by a push event for the same commit hash.
Navigating to the summary of the run should indicate which branch triggered the run.
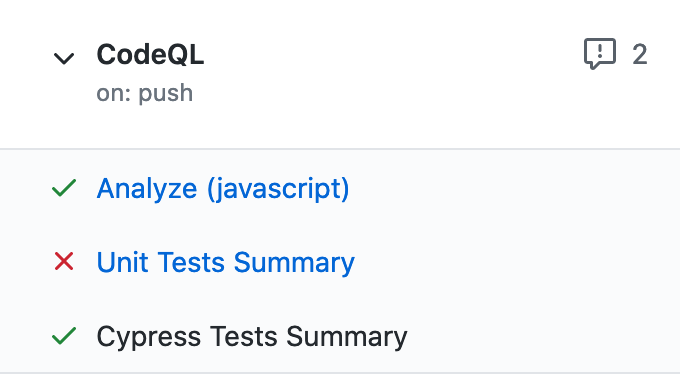
Test summaries appear under wrong workflows
Occasionally, the Unit Tests Summary and Cypress Tests Summary may appear under workflows other than "Continuous Integration".
This is a bug with how GitHub Actions and check runs that hasn't yet been fixed.
Although they may appear under different workflows, they can still be found in the overall list of PR check statuses or in commit statuses.
Help and feedback
-
Get help from the Platform Support Team in Slack.
-
Submit a feature idea to the Platform.